Numbers
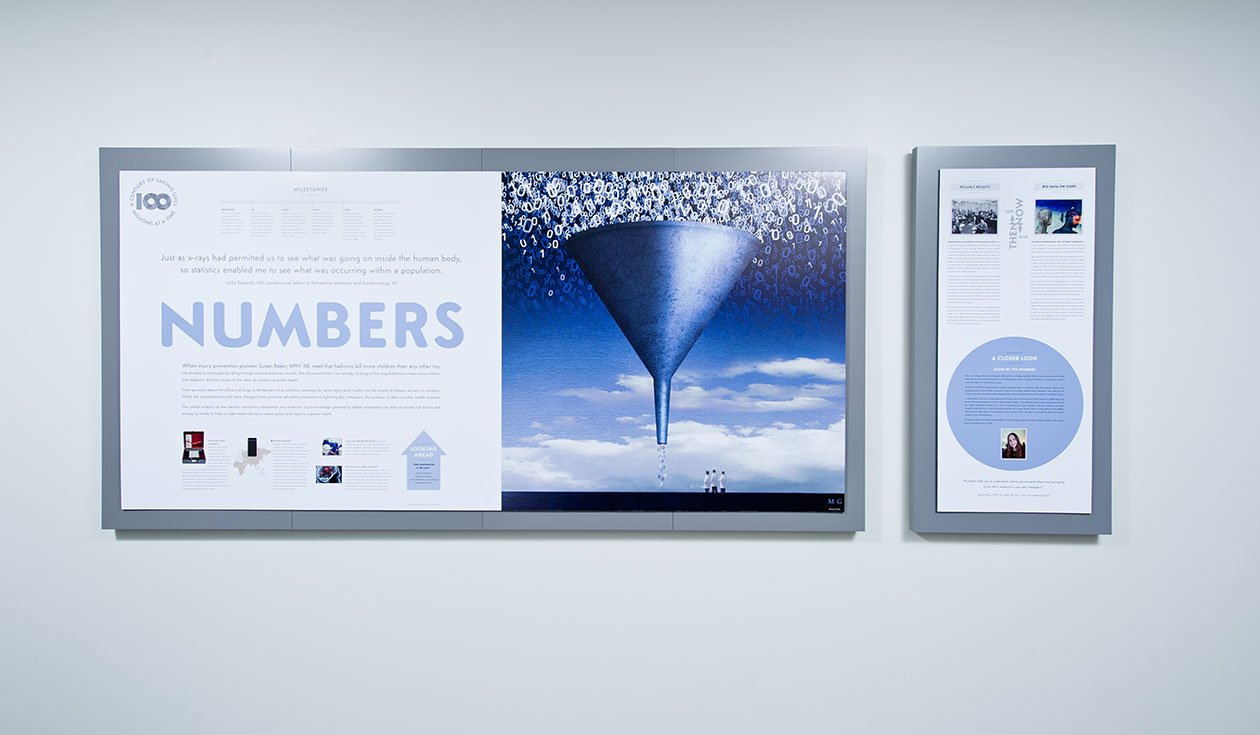
“Numbers help you to understand where you are and where you are going. If you don’t measure it, you can’t manage it.”
David Peters, DrPH ’93, MPH ’89, MD, Chair,
International Health
When injury prevention pioneer Susan Baker, MPH ’68, read that balloons kill more children than any other toy, she decided to investigate by sifting through medical examiner records
She discovered that in her sample, choking on hot dogs killed three times more children than balloons. Another lesson in the value of numbers to public health.
From questions about the efficacy of drugs to the dangers of air pollution, strategies for better aging and insights into the spread of disease, we rely on numbers. While the computational tools have changed from primitive calculating machines to lightning-fast computers, the primacy of data in public health endures.
The careful analysis of raw statistics transforms information into evidence. Such knowledge gleaned by skilled researchers can then illuminate risk factors and emerging trends to help us make better decisions about policy and ways to improve health.
Numbers
197,274,000
197,274,000
The maximum future size of the continental U.S. population predicted by Raymond Pearl and Lowell Reed, who were the first to use a logistic curve to predict population growth. (1920)
39
39
Number of biostatistics departments established in U.S. schools of public health after Lowell Reed coined the term to indicate the broad applications for statistics across biomedicine and the life sciences. (1930)
46,825
46,825
Number of citations of “Nonparametric estimation from incomplete observations,” in which Paul Meier at JHSPH and co-author Edward L. Kaplan explained their famous Kaplan-Meier survival function estimator (1960)
3 BILLION
3 BILLION
Number of bytes of data from the original National Death Index containing 21 million death records from 1968 to 1978, compiled by biostatistician Alan M. Gittelsohn (1982)
13,095
13,095
Number of citations of “Longitudinal data analysis using generalized linear models,” in which Kung-Yi Liang and Scott L. Zeger define the General Estimating Equation for determining the effect of variables on disease transmission (1986)
102,000
102,000
Number of new AIDS cases that Ronald Brookmeyer forecasted would occur between 1986 and 1991, correctly anticipating the heightened impact of the AIDS epidemic after the CDC predicted it would peak in 1988 (1986)
Then & Now

Then: Reliable Results
BIOSTATISTICS WAS BORN AT THE SCHOOL IN 1930 when Lowell J. Reed, Chair of Vital Statistics, coined the term and renamed his Department. The new moniker reflected a potent discipline with a statistical framework for biological processes across science, medicine and public health. With uniform coding of statistics on death and disease, researchers could reliably analyze numbers to advance public health. Reed and epidemiologist Wade Hampton Frost, founding chair of Epidemiology, collaborated to develop the Reed-Frost model, a mathematical model designed to predict the spread of acute, contagious disease.
A brilliant teacher of statisticians, Margaret Merrell, ScD ’30, helped the field progress by instructing generations of students. Her work as principal statistician for World War II-era penicillin trials laid the foundation for modern penicillin therapy for bacterial illnesses and infections. These studies also established scientific and statistical methods for randomized controlled trials (RCT), which remain the gold standard for clinical research. RCTs protect the public from ineffective and dangerous drugs and determine which medications work best and at what dosage.
In the latter half of the 20th century, biostatisticians and epidemiologists exposed the risks of smoking and the dangers of second-hand smoke. In the 1980s, Ronald Brookmeyer developed statistical models to accurately forecast the magnitude and course of the HIV/AIDS epidemic, allowing policymakers and health care providers to better target their efforts and resources.

Now: Big Data On Sleep
TOO MUCH INFORMATION—TMI, IN TODAY’S PARLANCE— is not a problem for researchers who welcome the era of Big Data. But the capability to amass huge quantities of statistics is helpful only if researchers can discern patterns and meaning in the deluge. Take sleep, for instance. Some 70 million Americans have a chronic sleep disorder or intermittent sleep problem, costing $50 billion annually in lost productivity and $16 billion in health care costs—in addition to 1,500 lives lost in car crashes caused each year by drowsy drivers. Now scientists are linking sleep deprivation and sleep disorders with such health problems as increased risk of hypertension, diabetes, obesity, depression, heart attack and stroke.
These connections are becoming apparent as a result of reports from multiple sleep studies based on information on eye movement, heart activity, leg activity, oxygen levels, respiration and more. High-tech sensors can record such data as often as 500 times per second. The challenge: Making sense of the voluminous information.
An interdisciplinary team of Bloomberg School collaborators is sifting through the data, identifying patterns, teasing out previously hidden differences in various sleep stages, and making the data available to devise and test potential solutions. For example, senior volunteers in the Experience Corps program are being studied to determine if their engagement with young students leads to better sleep, better health and improved cognition.
A CLOSER LOOK

Aging By The Numbers
Why is one 65-year-old active and vigorous while another is withdrawn and frail? Why are some minds lively at 90 while others dimmed much earlier? Researchers at the interdisciplinary Center on Aging and Health are counting on the numbers to provide insights into the dynamics of aging.
The Women’s Health and Aging Study, for example, investigated frailty as a syndrome, rather than separate symptoms, and developed precise metrics (a frailty assessment) to identify it, says Karen Bandeen-Roche, Biostatistics chair. Data from the 20-year-long study, now joined by brain imaging and gene sequencing, generated enormous datasets to be sifted for insights.
In other research, teams led by social epidemiologist Thomas Glass and biostatistician Ciprian Crainiceanu clipped measuring devices called accelerometers to the hips of elderly research subjects. “We started by processing the accelerometer data into the smallest meaningful movement units, which we called movelets,” says Crainiceanu. The team created a movement- recognition algorithm that crunched the terabyte-size data into compact, distinct motions—sitting, getting up and walking. The information sheds light on the mechanics of these activities, which may lead to novel ways to predict and prevent problems seniors may experience.
As data are collected and made comprehensible, the numbers suggest interventions that can keep us healthier, more resilient and more mentally agile as we age.
Display Credits
Main Illustration
- Michael Gibbs
Other Content
-
Monroematic Calculator: Chris Myers, object courtesy of Alan Chesney Medical Archives
-
Smartphone: Copyright/iStock/Cesare Andrea Ferrari
-
Ebolla Prayer Photo: © 2014 Kevin Sieff/The Washington Post, Courtesy of Photoshare
- Brain Image: JHSPH
Then and Now
- Then: Biostatistics Classroom Photo: Alan Chesney Medical Archives
- Now: Big Data on Sleep Illustration: Dung Hoang
A Closer Look
- Karen Bandeen Roche: Chris Hartlove