Transparency, Reproducibility, and Validation of COVID-19 Projection Models
BY JIN JIN, NEHA AGARWALA, PROSENJIT KUNDU, YI WANG, RUZHANG ZHAO, AND NILANJAN CHATTERJEE | JUNE 22, 2020
An Exponential Growth in Models with No Sign of Plateauing
Models for projecting infectious disease spread have always played an important role in informing public health policy worldwide. But never in history have the public and media have been so acutely aware of the existence and importance of these models as in the wake of the COVID-19 pandemic.
Researchers and policymakers are relying on these models to plan responses at the national and local levels. Moreover, the public is also keenly following trends, hoping that these models can predict when life will be normal again, whether that means going back to work and school, planning the next vacation or simply getting a haircut.
In the rapid wake of the first phase of the epidemic, quick projections were needed. The models that were readily available received a lot of attention from the media and government officials. It is now increasingly clear that this pandemic will continue to disrupt life for months–and possibly years–to come. Critical decisions regarding lockdowns, social distancing, and resource distribution will continue to rely heavily on some of these models.
New models are continuously emerging and it is hard to know which of these forecasts are reliable. Often, conflicting messages from different models create a sense of further uncertainty during a time of crisis.
We believe that society will be better served if the variety of forecasts available are less, and the ones that are available are more vetted for their reliability. To illustrate, how we may evaluate reliability of models in the future, we examined some available models—including two of the most influential ones—using three criteria:
We used data from Italy and New York—available on Github CSSEGISandData COVID-19 and Github NYTimes COVID-19-data—two places where the pandemic has been acute but has achieved peak in terms of deaths per day. We used varying amounts of data, going back in time up to the peaks and then examined how the models performed in forecasting future short-term trends compared to observed patterns through May 1, 2020.
Comparative Evaluation of Two Influential Models for Predicting Deaths
Arguably two models, one developed at the Imperial College London (ICL) and the other at the Institute of Health Metrics (IHME), University of Washington, Seattle, have been the most influential for policy making in the U.S., U.K., and Europe.
In particular, around the middle of March, the ICL model predicted half a million deaths in the U.K. and 2 million in the U.S. due to COVID-19 in the absence of any mitigation effort. These projections drew the attention of policymakers for the urgency of implementing strict lockdowns and social distancing measures.
The IHME model gained attention in late March in the U.S., especially after results started being quoted in the White House daily news briefings. In addition to deaths, the model can predict hospitalizations and ICU admissions, and thus is likely to have been used in state-level resource planning. The model has come under criticism recently by infectious disease experts, but nevertheless it remains widely quoted by government and media personnel.
- Transparency
The source code for the ICL model is publicly available through GitHub. The code for applying the model in 11 European countries is available and the posted results are reproducible. However, users who are interested in applying this method on other datasets would need more instructive guidance for the data processing details and the setting of the parameters.
A report is available that describes the underlying methodology in a transparent way with adequate justifications provided for various model choices and assumptions. The methodology uses a Bayesian framework that builds upon a transmission model (see below) for underlying infected cases and specifies distribution of death among infected cases by borrowing information across countries. The report also describes various sensitivity analysis for the projections to various model choices and assumptions.
- Reproducibility
The IHME model source code is also accessible through GitHub. The IHME model projections are available for different locations, including the U.S. states and EEA countries on their website. However, the methodology and exact specification of parameters that are required to reproduce these results are not transparent, and hence the results are not reproducible. A report provides a brief description of the underlying methodology, which relies on fitting a fairly rigid parametric model to the observed data. The report, however, gives limited justifications on model choices and assumptions. In particular, it is hard to follow how the uncertainty in the projections are quantified and how the social distancing covariates are defined. The IHME model, however, has a new version since our analysis was done, and the updated version has better documentation.
- Validity
Figure 1 shows that the IHME model generally produced good estimates of timing and intensity of deaths at the peak using data until 7 days prior to the peak. But the peak predictions were not that reliable when data were used 14 days prior to the peak.
Further, the model is predicting a fast decline of deaths following the peak. The current trend, however, suggests that the post-peak decline is following much gentler trends. In fact, the observed number of cumulative deaths often exceeded the upper confidence bands. The ICL model overestimated the number of daily deaths in Italy, though the observed trends were within the confidence band (shaded region) provided.
For New York, the predicted and observed trends were quite similar, but the confidence bounds around projected trends were very wide when the models were built using data one or two week prior to the peak.
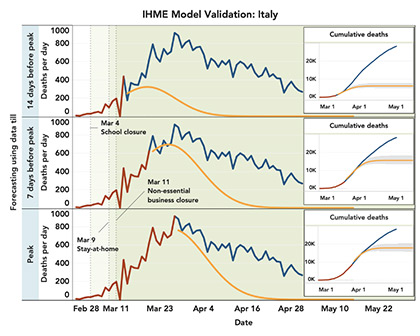
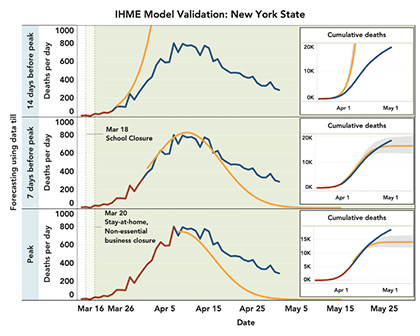
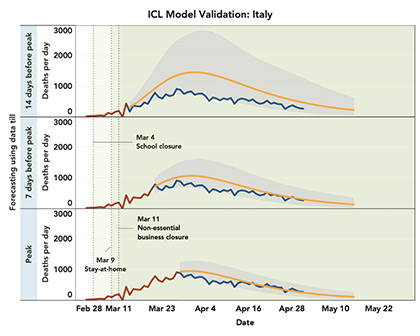
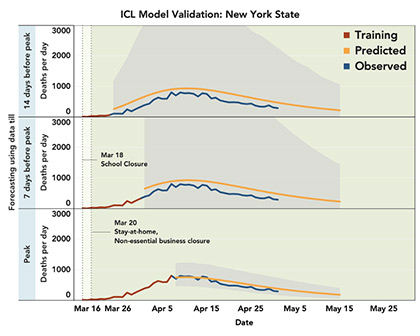
Figure 1. Validation of IHME (old version) and ICL models. Models are built using “training” data (brown line) up to 14 days or 7 days prior to the peak, or all the data until the peak. The observed daily peaks for daily deaths are on March 27th and April 7th for Italy and New York, respectively. The predicted trends after the training period (orange line) are compared with observed trends (blue line). Shaded regions show 95% confidence bounds around the predicted trends. For the IHME model, confidence regions are not available for daily death and instead those are shown for cumulative deaths. Data are shown starting from the day cumulative deaths reached 0.31 per million (criterion used by IHME model fitting).
Summary Findings and Cautions
Among the two popular models, we found that the ICL model is more transparent and reproducible compared to the IHME model. The former sometimes over-predicted future deaths while the latter clearly under-predicted post-peak deaths. Both models predicted the timing of peaks reasonably well using data until one week prior. The ICL model produced a much wider band of uncertainty for New York state, possibly because the pattern did not conform well with their internal training data used from European countries.
Put more emphasis on shorter term projections and uncertainty
We advocate more emphasis on communicating uncertainty around projections. The ICL model incorporates a flexible Bayesian modeling framework and can produce very wide bands of uncertainty around projected trends.
The IHME model produces narrower uncertainty bands, but it is likely to be underestimating uncertainty due to the use of a very rigid model that cannot explain observed trends. In the future, modelers need to communicate levels and sources of uncertainty more forcefully and be aware that sometimes, the main finding might be the level of uncertainty itself.
Media and government personnel also need to pay more attention to the range of uncertainty and be more cautious about promoting statistics that have too much uncertainty around them. The best practice may be to emphasize more shorter term projections and be aware of probable worst-case scenarios for longer term trends, as may be indicated by the upper confidence bounds of some of the most reliable projections.
Do not overuse the models
We also advocate more caution in using these models to evaluate effectiveness of interventions given the large uncertainty in estimates.
For example, in a Medium article by COV-IND-19 Study Group, researchers used a transmission model to project that in India, in the absence of lockdown, the number of cases would be around 35,000 by April 30 and, if a lockdown was effective, then the number of cases could be as low as near 4,000.
In fact, by the day the article was posted—April 3—the number of cases in India was 2,567. By April 30, the reported cases accrued very close to 35,000. While the authors, to their credit, acknowledge the large range of uncertainty, it is not easy for policymakers and the public to grasp the concept of uncertainty, and such analysis may create the unintended impression that lockdown may not have been effective.
Our analysis has limitations too
Results from our own analysis should be interpreted with caution as well. We have only used data from two high-intensity regions to examine the validity of model projections. The patterns may be different in lower-intensity regions and countries, and we plan to present more extensive analysis using additional data in a research publication later.
We have attempted to implement the different models as best possible based on available documentation. It is possible that we have not implemented some of them in the ideal setting the way the modelers had intended. Further, both ICL and IHME models have been updated recently after we completed our analysis, and these newer versions of the models may have improved validity. We also acknowledge that there may be ambiguity in what model validation may mean in a very dynamic situation like a pandemic, where implementation and removal of interventions is expected to change observed trends compared to the predicted values.
Nevertheless, we believe as more data become available through the entire cycle of the first phase of the epidemic under different types of interventions, it would be increasingly possible to properly define and demonstrate model validation.
Mitigation Needed
Going forward, more effort is clearly needed to better vet models following principles of transparency, reproducibility, and validity.
Models that do not accompany open-source codes that other quantitative researchers can access, manipulate, and experiment with cannot be relied upon. Specific projections using these models should also accompany additional open source codes, specifications, and data so that other researchers can exactly reproduce the results.
Moreover, as more empirical data become available on the full cycle of the first phase of the epidemic, modelers should consider showing validation of their own projections using retrospective data. Yet, while we apply these principles, it is important to remember that everything related to the pandemic needs to be done in an urgent manner with limited time and resources. Thus, we call for quantitative researchers who are keen to contribute to the field to direct their efforts to evaluating and possibly tuning existing models.
Clearly, in the future, if the forecasting model is to be more precise, it needs to incorporate other types of data beyond the simple time-series data on the pandemic itself. Like prediction of the stock market will have much more limited value unless information on housing and labor markets, industry outlooks, and consumer behavior is incorporated into the models, we cannot expect much more precision from COVID-19 forecasting models unless other types of data, such as mobile and GPS-based movement information or survey data on public behavior under different types of interventions, are incorporated.