Measurement and Data
National Geographically Diverse Cohort – Methods for Area-Level Exposures
One of the challenges in ECHO is that all “neighborhood” or area-level exposures need to be available for at least the contiguous United States and have appropriate temporal coverage for analyses. ECHO-wide cohort participants live across the United States in a variety of geographic and sociodemographic contexts, so it is important to apply or develop area-level capture that measure relevant aspects of the environment across diverse contexts.
Participant residential histories across the life span
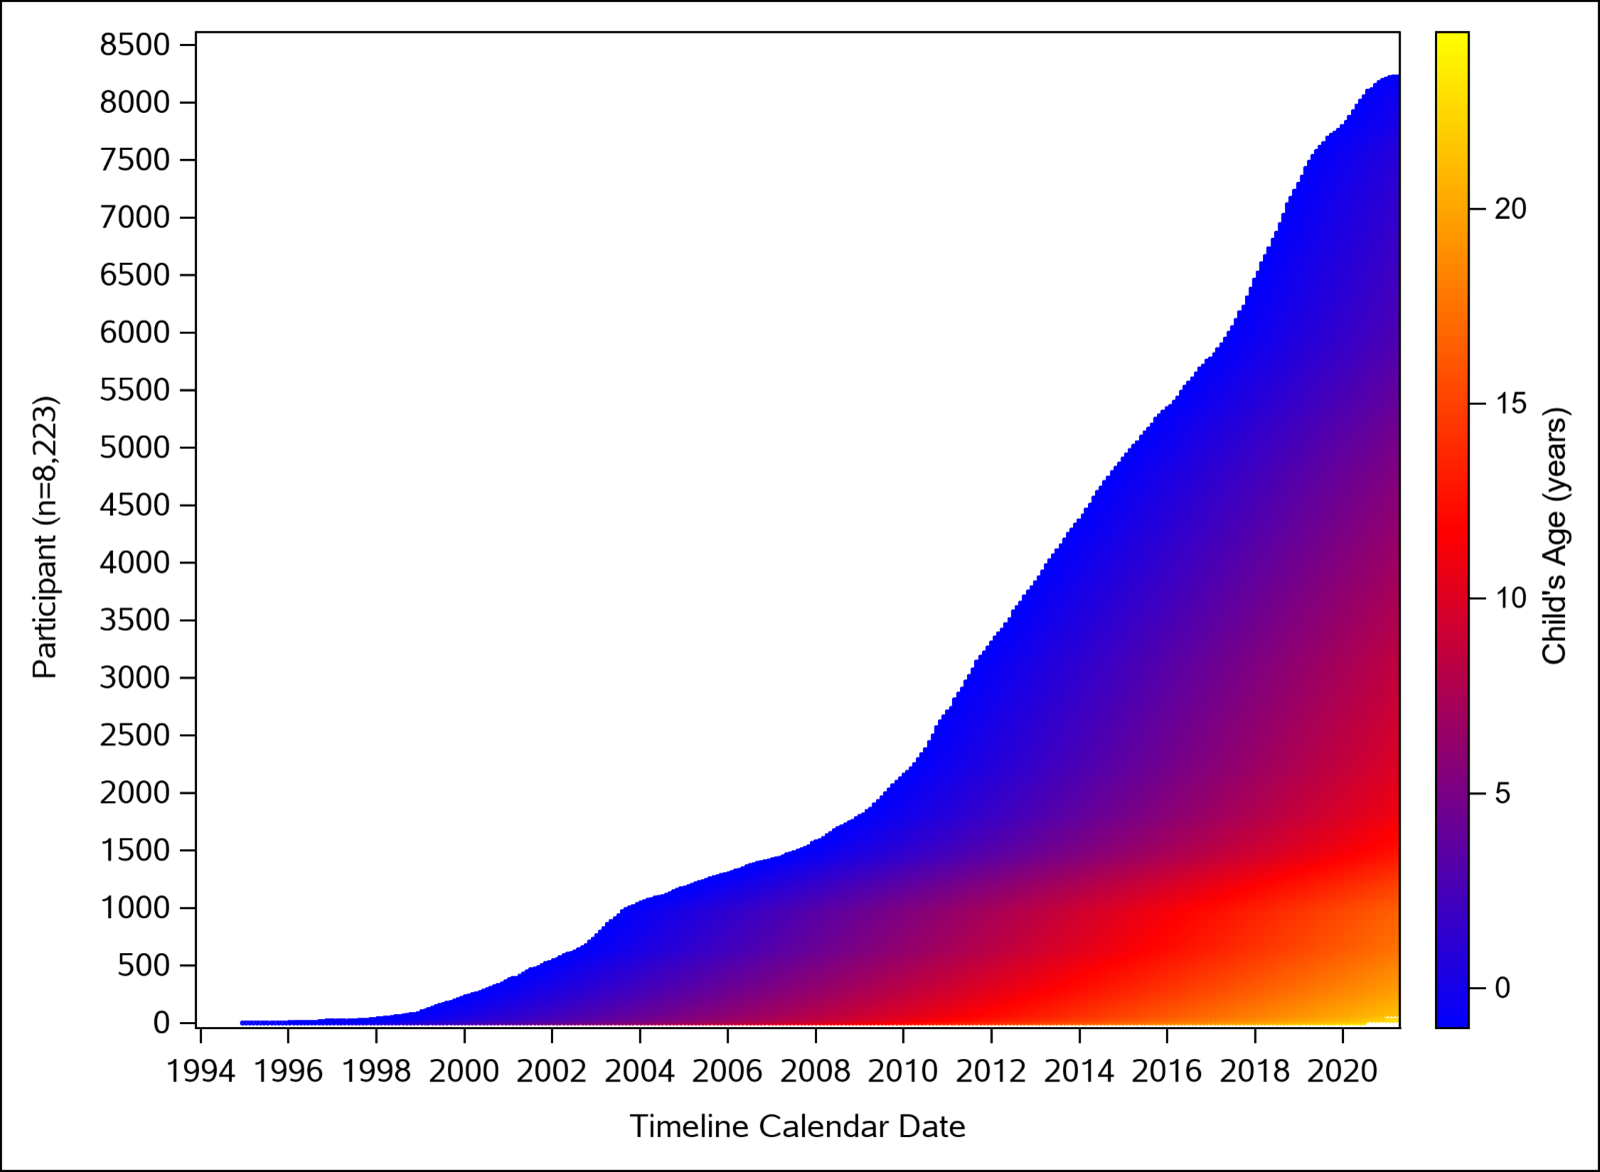
The ECHO-wide data Collection Protocol (EWCP) specifies collection of participant residential history during each life stage. These data are cleaned and compiled by Research Triangle Institute, creating a rich resource for future research.

This is a 30% sample of the residential history file (total N = 24,669). The graphic shows months of residential history data by calendar time. The oldest children are at the bottom with residential history data from 1994-present. The top of the graph shows the relatively small duration (i.e., < 12 months) of residential history data for children born in 2020. Link to full size image.
Area-level exposures
The ECHO DAC is working with ECHO investigators across the country to develop national time-varying area-level exposures.
| Developing a National-Scale Exposure Index for Combined Environmental Hazards and Social Stressors and Applications to the Environmental Influences on Child Health Outcomes (ECHO) Cohort | Sheena E. Martenies, Mingyu Zhang, Anne E. Corrigan, Anton Kvit, Timothy Shields, William Wheaton, Deana Around Him, Judy Aschner, Maria M. Talavera-Barber, Emily S. Barrett, Theresa M. Bastain, Casper Bendixsen, Carrie V. Breton, Nicole R. Bush, Ferdinand Cacho, Carlos A. Camargo, Jr., Kecia N. Carroll, Brian S. Carter, Andrea E. Cassidy-Bushrow, Whitney Cowell, Lisa A. Croen, Dana Dabelea, Cristiane S. Duarte, Anne L. Dunlop, Todd M. Everson, Rima Habre, Tina V. Hartert, Jennifer B. Helderman, Alison E. Hipwell, Margaret R. Karagas, Barry M. Lester, Kaja Z. LeWinn, Sheryl Magzamen, Rachel Morello-Frosch, Thomas G. O’Connor, Amy M. Padula, Michael Petriello, Sheela Sathyanarayana, Joseph B. Stanford, Tracey J. Woodruff, Rosalind J. Wright, and Amii M. Kress on behalf of Program Collaborators for Environmental Influences on Child Health Outcomes. Developing a National-Scale Exposure Index for Combined Environmental Hazards and Social Stressors and Applications to the Environmental Influences on Child Health Outcomes (ECHO) Cohort. Int. J. Environ. Res. Public Health 2023, 20, 6339. https://doi.org/10.3390/ijerph20146339 |
| Tools for assessing multiple exposures across several domains (e.g., physical, chemical, and social) are of growing importance in social and environmental epidemiology because of their value in uncovering disparities and their impact on health outcomes. Here we describe work done within the Environmental influences on Child Health Outcomes (ECHO)-wide Cohort Study to build a combined exposure index. Our index considered both environmental hazards and social stressors simultaneously with national coverage for a 10-year period. Our goal was to build this index and demonstrate its utility for assessing differences in exposure for pregnancies enrolled in the ECHO-wide Cohort Study. Our unitless combined exposure index, which collapses census-tract level data into a single relative measure of exposure ranging from 0–1 (where higher values indicate higher exposure to hazards), includes indicators for major air pollutants and air toxics, features of the built environment, traffic exposures, and social determinants of health (e.g., lower educational attainment) drawn from existing data sources. We observed temporal and geographic variations in index values, with exposures being highest among participants living in the West and Northeast regions. Pregnant people who identified as Black or Hispanic (of any race) were at higher risk of living in a “high” exposure census tract (defined as an index value above 0.5) relative to those who identified as White or non-Hispanic. Index values were also higher for pregnant people with lower educational attainment. Several recommendations follow from our work, including that environmental and social stressor datasets with higher spatial and temporal resolutions are needed to ensure index-based tools fully capture the total environmental context. | |
| Associations between combined exposure to environmental hazards and social stressors at the neighborhood level and individual perinatal outcomes in the ECHO-wide cohort | Martenies SE, Zhang M, Corrigan AE, Kvit A, Shields T, Wheaton W, Bastain TM, Breton CV, Dabelea D, Habre R, Magzamen S, Padula AM, Him DA, Camargo CA Jr, Cowell W, Croen LA, Deoni S, Everson TM, Hartert TV, Hipwell AE, McEvoy CT, Morello-Frosch R, O'Connor TG, Petriello M, Sathyanarayana S, Stanford JB, Woodruff TJ, Wright RJ, Kress AM; program collaborators for Environmental influences on Child Health Outcomes. Associations between combined exposure to environmental hazards and social stressors at the neighborhood level and individual perinatal outcomes in the ECHO-wide cohort. Health Place. 2022 Jul;76:102858. doi: 10.1016/j.healthplace.2022.102858. Epub 2022 Jul 21. PMID: 35872389. |
| Limited studies examine how prenatal environmental and social exposures jointly impact perinatal health. Here we investigated relationships between a neighborhood-level combined exposure (CE) index assessed during pregnancy and perinatal outcomes, including birthweight, gestational age, and preterm birth. Across all participants, higher CE index scores were associated with small decreases in birthweight and gestational age. We also observed effect modification by race; infants born to Black pregnant people had a greater risk of preterm birth for higher CE values compared to White infants. Overall, our results suggest that neighborhood social and environmental exposures have a small but measurable joint effect on neonatal indicators of health. | |
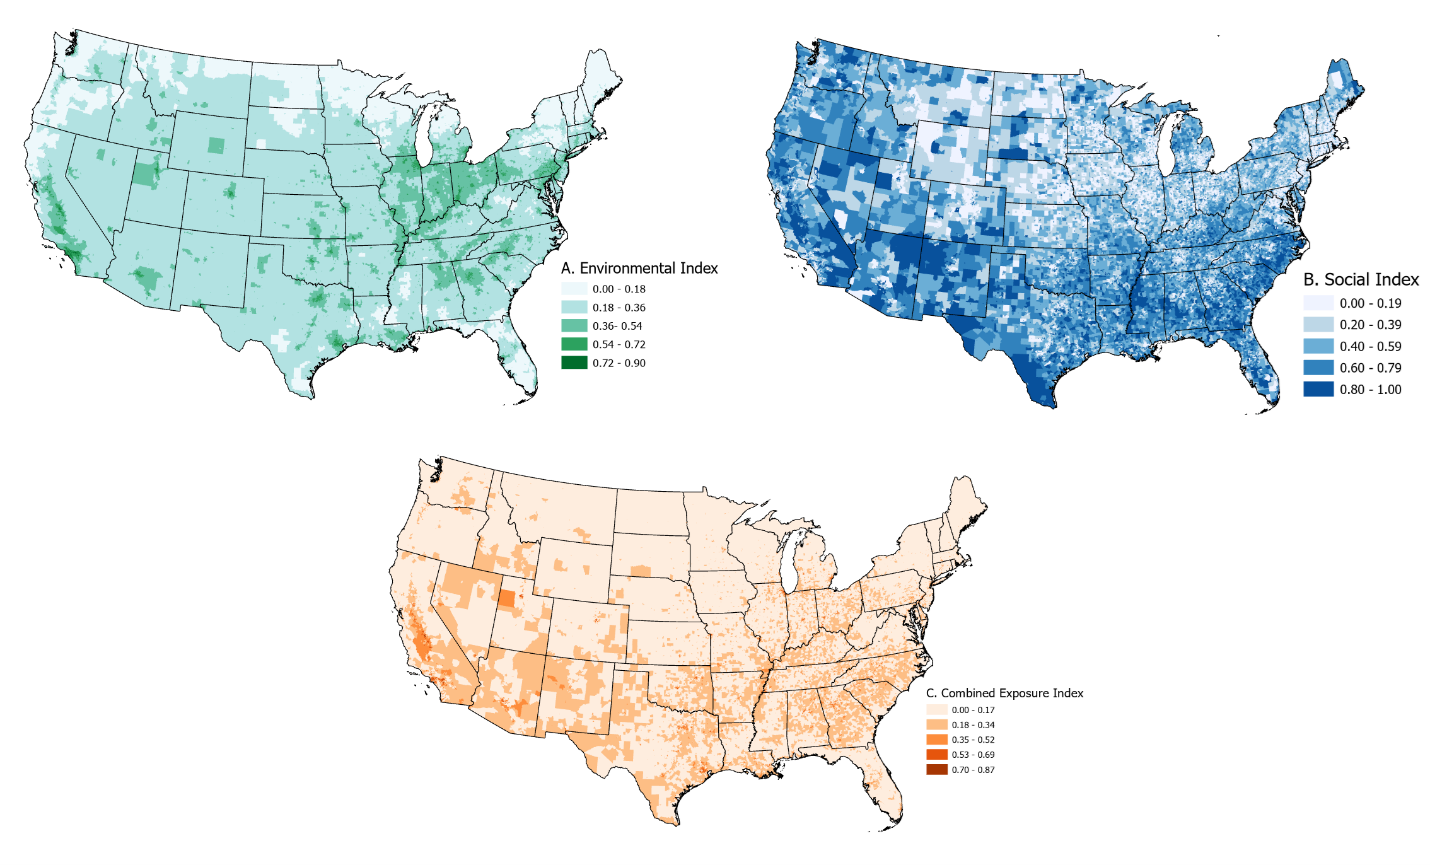
Combined social and environmental stressor Exposure (CE), 2010-2019
In a ECHO -wide Cohort Study, we developed a new measure of Combined Social and Environmental Stressors based on CalEnviroScreen. In order to be useful for ECHO, we had to modify the methods and indicators in order to have input data that are available for the US.
Social stressors – After examining potential national-level indicators (e.g., crime data) with temporal coverage for our study, we decided to use an existing measure - Centers for Disease Control and Prevention Agency for Toxic Substances and Disease Registry’s Social Vulnerability Index (SVI) (Agency for Toxic Substances & Disease Registry, 2021). The SVI describes the relative vulnerability of every U.S. census tract based on 15 indicators grouped into four themes:
1. Socioeconomic status
2. Household composition and disability
3. Minority status and language
4. Housing type and transportation
The overall ranking (range: 0 - 1, was used for the social exposure index. The 2010, 2014, 2016, and 2018 SVI data were used in the index. applied to the social exposure index focusing on midpoint years (2010 SVI 2010, 2014 to 2011-2012, 2016 to 2013-2015, and 2018 to 2016-2019).
Environmental stressors - The environmental exposure index (ENV) was generated seven unique input datasets categorized into two scores:
- Air pollution: annual average estimates of particulate matter less than 2.5µm in aerodynamic diameter (PM2.5), ozone, toxic air emissions from major facilities, and traffic density
- Built environment: tree canopy, impervious surfaces, and proximity to Superfund sites
Annual census tract values were converted to percentiles and rescaled (range: 0 to 1).
Consistent with the CalEnviroScreen 3.0 index, the final environmental index is the weighted average of the air pollution and built environment score: [(Air Pollution Score * 1) + (Built Environment Score*0.5) / 1.5].
Combined Exposure (CE) - The CE index was calculated as the product of ENV and SOC indices (i.e., CE = ENV * SOC).
Average Index Scores by Census Tract, 2010-2019

Download Analytic File – Coming Soon!
“Neighborhood” Socioeconomic Status
Drs. Knapp and Kress are working on a systematic review of all neighborhood SES/disadvantage datasets and will use this review to inform the development of a national-level time varying measure of “neighborhood” SES for use in ECHO-wide analyses.
| Unpacking Neighborhood Socioeconomic Status in Children’s Health Research from an Environmental Justice Perspective: A Scoping Review | Bhaktaram, A., Kress, A.M., Li, Z. et al. Unpacking Neighborhood Socioeconomic Status in Children’s Health Research from an Environmental Justice Perspective: A Scoping Review. Curr Envir Health Rpt 11, 288–299 (2024). https://doi.org/10.1007/s40572-024-00445-8 |
| We observed methodological challenges related to the identification of neighborhood boundaries, indicator selection, and nSES measure definition(s). We discuss common pitfalls in neighborhood research that can complicate identifying, targeting, and resolving environmental injustices. Lastly, we put forward a series of recommendations to reduce measurement error and improve inference, in addition to reporting recommendations for neighborhoods and health research that can aid in improving our understanding of pathways between neighborhood context and child health, inform policy development, and allocate resources to achieve environmental justice. | |
ECHO Atlas
Now introducing the ECHO DAC Atlas!
Collaborative work between the ECHO DAC and Spatial Science for Public Health Center!
The ECHO DAC is creating summary files of area-level exposures of interest across ECHO research and to the broader research community. Check back soon for time-varying national-level data and documentation on measures of area-level socioeconomic status, segregation, and other important area-level measures.
Public Use Datasets – Coming Soon!
Novel Measurement Methodology
Wearable Devices
Accelerometers
The ECHO DAC has a team of experts in designing studies that use accelerometer to collect activity data and analyzing these high dimensional data.
Expert Panel Overview of Accelerometers in Pediatric Research
| Measuring Positive Health Using Wearable Devices | Ciprian Crainiceanu and Ekaterina Smirnova |
-OMICS
Microbiome
ECHO-wide platform for studying mother-to-infant vertical transmission of microbiota
Dr. Mueller has an ECHO Opportunities and Infrastructure Fund grant to answer the following questions:
- To what extent is the neonatal gut microbiota seeded by maternal vaginal microbiota vs. maternal intestinal microbiota? and
- How is this process affected by maternal antibiotic intake during pregnancy and perinatal period and delivery mode?
Dr. Mueller is working with multiple DAC investigators (Drs. Kress, Smironva, and Zhao) and ECHO cohort investigators on this new and exciting research.
| Mother-Child Sharing of Fecal and Vaginal Microbiota and Disruption by Prenatal Antibiotics and Delivery Mode: An ECHO-Wide Study | Liu T*, Kress AM, Debelius J, Zhao N, Smirnova E, Bandyopadhyay S, Comstock S, Gill A, Gill S, Gern JE, Koinis-Mitchel D, Klepac-Ceraj V, Lee-Sarwar K, McKee K, McCauley K, O’Connor TG, Paneth N, Rosas-Salazar C, Scheible K, Stanford J, Jacobson LP, Mueller NT. Mother-Child Sharing of Fecal and Vaginal Microbiota and Disruption by Prenatal Antibiotics and Delivery Mode: An ECHO-Wide Study. iScience (in press). |
| Link coming soon! | |
Genetics & Epigenetics
Benchmarking statistical methods for analyzing parent-child dyads in genetic association studies
| Benchmarking statistical methods for analyzing parent-child dyads in genetic association studies | Ray D, Vergara C, Taub MA, Wojcik G, Ladd-Acosta C, Beaty TH, Duggal P. Benchmarking statistical methods for analyzing parent-child dyads in genetic association studies. Genet Epidemiol. 2022 Apr 22. doi: 10.1002/gepi.22453. Epub ahead of print. PMID: 35451532. |
| Genetic association studies of child health outcomes often employ family-based study designs. One of the most popular family-based designs is the case-parent trio design that considers the smallest possible nuclear family consisting of two parents and their affected child. This trio design is particularly advantageous for studying relatively rare disorders because it is less prone to type 1 error inflation due to population stratification compared to population-based study designs (e.g., case-control studies). However, obtaining genetic data from both parents is difficult, from a practical perspective, and many large studies predominantly measure genetic variants in mother-child dyads. While some statistical methods for analyzing parent-child dyad data (most commonly involving mother-child pairs) exist, it is not clear if they provide the same advantage as trio methods in protecting against population stratification, or if a specific dyad design (e.g., case-mother dyads vs. case-mother/control-mother dyads) is more advantageous. In this article, we review existing statistical methods for analyzing genome-wide marker data on dyads and perform extensive simulation experiments to benchmark their type I errors and statistical power under different scenarios. We extend our evaluation to existing methods for analyzing a combination of case-parent trios and dyads together. We apply these methods on genotyped and imputed data from multiethnic mother-child pairs only, case-parent trios only or combinations of both dyads and trios from the Gene, Environment Association Studies consortium (GENEVA), where each family was ascertained through a child affected by nonsyndromic cleft lip with or without cleft palate. Results from the GENEVA study corroborate the findings from our simulation experiments. Finally, we provide recommendations for using statistical genetic association methods for dyads. | |
| Download the related R program from GitHub here | |
PLACO
A powerful method for pleiotropic analysis under composite null hypothesis identifies novel shared loci between case-control traits/disease
| A powerful method for pleiotropic analysis under composite null hypothesis identifies novel shared loci between case-control traits/disease | Ray D, Chatterjee N. A powerful method for pleiotropic analysis under composite null hypothesis identifies novel shared loci between Type 2 Diabetes and Prostate Cancer. PLoS Genet. 2020 Dec 8;16(12):e1009218. doi: 10.1371/journal.pgen.1009218. PMID: 33290408; PMCID: PMC7748289 |
| There is increasing evidence that pleiotropy, the association of multiple traits with the same genetic variants/loci, is a very common phenomenon. Cross-phenotype association tests are often used to jointly analyze multiple traits from a genome-wide association study (GWAS). The underlying methods, however, are often designed to test the global null hypothesis that there is no association of a genetic variant with any of the traits, the rejection of which does not implicate pleiotropy. In this article, we propose a new statistical approach, PLACO, for specifically detecting pleiotropic loci between two traits by considering an underlying composite null hypothesis that a variant is associated with none or only one of the traits. We propose testing the null hypothesis based on the product of the Z-statistics of the genetic variants across two studies and derive a null distribution of the test statistic in the form of a mixture distribution that allows for fractions of variants to be associated with none or only one of the traits. We borrow approaches from the statistical literature on mediation analysis that allow asymptotic approximation of the null distribution avoiding estimation of nuisance parameters related to mixture proportions and variance components. Simulation studies demonstrate that the proposed method can maintain type I error and can achieve major power gain over alternative simpler methods that are typically used for testing pleiotropy. PLACO allows correlation in summary statistics between studies that may arise due to sharing of controls between disease traits. Application of PLACO to publicly available summary data from two large case-control GWAS of Type 2 Diabetes and of Prostate Cancer implicated a number of novel shared genetic regions: 3q23 (ZBTB38), 6q25.3 (RGS17), 9p22.1 (HAUS6), 9p13.3 (UBAP2), 11p11.2 (RAPSN), 14q12 (AKAP6), 15q15 (KNL1) and 18q23 (ZNF236). | |
Generalizing PLACO to identify novel shared loci between diseases or disease-subtypes from family-based designs
| Pleiotropy method reveals genetic overlap between orofacial clefts at multiple novel loci from GWAS of multi-ethnic trios | Ray D, Venkataraghavan S, Zhang W, Leslie EJ, Hetmanski JB, Weinberg SM, Murray JC, Marazita ML, Ruczinski I, Taub MA, Beaty TH. Pleiotropy method reveals genetic overlap between orofacial clefts at multiple novel loci from GWAS of multi-ethnic trios. PLoS Genet. 2021 Jul 9;17(7):e1009584. doi: 10.1371/journal.pgen.1009584. PMID: 34242216; PMCID: PMC8270211. |
| Based on epidemiologic and embryologic patterns, nonsyndromic orofacial clefts– the most common craniofacial birth defects in humans– are commonly categorized into cleft lip with or without cleft palate (CL/P) and cleft palate alone (CP), which are traditionally considered to be etiologically distinct. However, some evidence of shared genetic risk in IRF6, GRHL3 and ARHGAP29 regions exists; only FOXE1 has been recognized as significantly associated with both CL/P and CP in genome-wide association studies (GWAS). We used a new statistical approach, PLACO (pleiotropic analysis under composite null), on a combined multi-ethnic GWAS of 2,771 CL/P and 611 CP case-parent trios. At the genome-wide significance threshold of 5 × 10⁻⁸, PLACO identified 1 locus in 1q32.2 (IRF6) that appears to increase risk for one OFC subgroup but decrease risk for the other. At a suggestive significance threshold of 10−6, we found 5 more loci with compelling candidate genes having opposite effects on CL/P and CP: 1p36.13 (PAX7), 3q29 (DLG1), 4p13 (LIMCH1), 4q21.1 (SHROOM3) and 17q22 (NOG). Additionally, we replicated the recognized shared locus 9q22.33 (FOXE1), and identified 2 loci in 19p13.12 (RAB8A) and 20q12 (MAFB) that appear to influence risk of both CL/P and CP in the same direction. We found locus-specific effects may vary by racial/ethnic group at these regions of genetic overlap, and failed to find evidence of sex-specific differences. We confirmed shared etiology of the two OFC subtypes comprising CL/P, and additionally found suggestive evidence of differences in their pathogenesis at 2 loci of genetic overlap. Our novel findings include 6 new loci of genetic overlap between CL/P and CP; 3 new loci between pairwise OFC subtypes; and 4 loci not previously implicated in OFCs. Our in-silico validation showed PLACO is robust to subtype-specific effects, and can achieve massive power gains over existing approaches for identifying genetic overlap between disease subtypes. In summary, we found suggestive evidence for new genetic regions and confirmed some recognized OFC genes either exerting shared risk or with opposite effects on risk to OFC subtypes. |
| Download the PLACO R program from GitHub here |
Effect of non-normality and low count variants on cross-phenotype association tests in genetic association studies
| Effect of non-normality and low count variants on cross-phenotype association tests in GWAS | Ray D, Chatterjee N. Effect of non-normality and low count variants on cross-phenotype association tests in GWAS. Eur J Hum Genet. 2020 Mar;28(3):300-312. doi: 10.1038/s41431-019-0514-2. Epub 2019 Oct 3. PMID: 31582815; PMCID: PMC7028917. |
| Many complex human diseases, such as type 2 diabetes, are characterized by multiple underlying traits/phenotypes that have substantially shared genetic architecture. Multivariate analysis of correlated traits has the potential to increase the power of detecting underlying common genetic loci. Several cross-phenotype association methods have been proposed-some require individual-level data on traits and genotypes, while the others require only summary-level data. In this article, we explore whether non-normality of multivariate trait distribution affects the inference from some of the existing multi-trait methods and how that effect is dependent on the allele count of the genetic variant being tested. We find that most of these tests are susceptible to biases that lead to spurious association signals. Even after controlling for confounders that may contribute to non-normality and then applying inverse normal transformation on the residuals of each trait, these tests may have inflated type I errors for variants with low minor allele counts (MACs). A likelihood ratio test of association based on the ordinal regression of individual-level genotype conditional on the traits seems to be the least biased and can maintain type I error when the MAC is reasonably large (e.g., MAC > 30). Application of these methods to publicly available summary statistics of eight amino acid traits on European samples seem to exhibit systematic inflation (especially for variants with low MAC), which is consistent with our findings from simulation experiments. | |
| Download the imvtests R program from GitHub here | |
Chemicals
Urinary Biomarkers of Exposure -- Urinary Dilution
| Urinary specific gravity measures in the U.S. population: Implications for the adjustment of non-persistent chemical urinary biomarker data | Kuiper JR, O'Brien KM, Ferguson KK, Buckley JP. Urinary specific gravity measures in the U.S. population: Implications for the adjustment of non-persistent chemical urinary biomarker data. Environ Int. 2021 Nov;156:106656. doi: 10.1016/j.envint.2021.106656. Epub 2021 May 29. PMID: 34062395; PMCID: PMC8380693. |
Background: Urinary biomarkers are often corrected for sample dilution using creatinine, which is influenced by sociodemographic factors and certain health conditions. It is unknown whether these factors similarly influence specific gravity. Objectives: To identify predictors of specific gravity and creatinine and compare methods for correcting estimated chemical concentrations for sample dilution using these measures. Methods: We assessed predictors of urinary specific gravity and creatinine among NHANES 2007-2008 participants (n = 7257). We corrected concentrations of mono-n-butyl phthalate (MnBP) for dilution using two methods, each applied to both specific gravity and creatinine: correction using a sample mean of the dilution indicator (i.e., specific gravity or creatinine) and covariate-adjusted standardization. We compared distributions and assessed the agreement of uncorrected or corrected concentrations visually using Bland-Altman plots and statistically by Kendall's τa. We stratified all analyses by age category (i.e., 6-19 or 20+ years of age). Results: Gender, race/ethnicity, body mass index, and height were associated with urinary specific gravity and creatinine. Distributions of corrected MnBP concentrations were comparable for both methods and dilution indicators, but agreement between methods was greater for specific gravity. Additionally, specific gravity- and creatinine-corrected MnBP concentrations had slightly greater agreement with each other when corrected using a covariate-adjusted standardization method. Discussion: Specific gravity, like creatinine, is associated with sociodemographic and body composition variables. Accounting for these factors as part of the dilution correction method may be important to minimize bias. | |
| Statistical Approaches for Investigating Periods of Susceptibility in Children's Environmental Health Research | Buckley JP, Hamra GB, Braun JM. Statistical Approaches for Investigating Periods of Susceptibility in Children's Environmental Health Research. Curr Environ Health Rep. 2019 Mar;6(1):1-7. doi: 10.1007/s40572-019-0224-5. PMID: 30684243; PMCID: PMC6420841. |
Purpose of review: Children's environmental health researchers are increasingly interested in identifying time intervals during which individuals are most susceptible to adverse impacts of environmental exposures. We review recent advances in methods for assessing susceptible periods. Recent findings: We identified three general classes of modeling approaches aimed at identifying susceptible periods in children's environmental health research: multiple informant models, distributed lag models, and Bayesian approaches. Benefits over traditional regression modeling include the ability to formally test period effect differences, to incorporate highly time-resolved exposure data, or to address correlation among exposure periods or exposure mixtures. Several statistical approaches exist for investigating periods of susceptibility. Assessment of susceptible periods would be advanced by additional basic biological research, further development of statistical methods to assess susceptibility to complex exposure mixtures, validation studies evaluating model assumptions, replication studies in different populations, and consideration of susceptible periods from before conception to disease onset | |
| Environmental exposure mixtures: questions and methods to address them | Hamra GB, Buckley JP. Environmental exposure mixtures: questions and methods to address them. Curr Epidemiol Rep. 2018 Jun;5(2):160-165. doi: 10.1007/s40471-018-0145-0. Epub 2018 Apr 5. PMID: 30643709; PMCID: PMC6329601. |
Purpose of this review: This review provides a summary of statistical approaches that researchers can use to study environmental exposure mixtures. Two primary considerations are the form of the research question and the statistical tools best suited to address that question. Because the choice of statistical tools is not rigid, we make recommendations about when each tool may be most useful. Recent findings: When dimensionality is relatively low, some statistical tools yield easily interpretable estimates of effect (e.g., risk ratio, odds ratio) or intervention impacts. When dimensionality increases, it is often necessary to compromise this interpretablity in favor of identifying interesting statistical signals from noise; this requires applying statistical tools that are oriented more heavily towards dimension reduction via shrinkage and/or variable selection. Summary: The study of complex exposure mixtures has prompted development of novel statistical methods. We suggest that further validation work would aid practicing researchers in choosing among existing and emerging statistical tools for studying exposure mixtures. | |