Evaluation
This section includes resources to assist you with evaluating your innovation, beginning with developing an evaluation plan. The resources also provide guidance for collecting data (through surveys, interviews, and focus groups), using WIC MIS data to evaluate an innovation, and analyzing data using Microsoft Excel.
Evaluation Resources
The What and Why of Evaluation

What is evaluation?
You have all heard that WIC is a successful public health program that improves the health and nutrition of mothers, infants, and children. But how do we know that it is indeed successful? The answer is that throughout its history, there have been numerous evaluations of its impact on participant’s health, nutrition, and well-being.1 Evaluation is a structured process to determine if a program and its activities are effective at making the changes that they were expected to make. The evaluation process typically involves systematically collecting information from various stakeholders involved in the program2 using a set of measures which can be from the same program or other similar programs to evaluate program performance.3
The feedback and results collected during the evaluation process are usually used to improve program implementation and future development.2 The reasons for evaluating a public health program are to monitor the process of a program, determine the effectiveness of the program in achieving its goal, provide justification for program funding, and improve the quality of a program.3 Evaluation can allow public health agencies, including WIC, to make evidence-based changes to their interventions in order to be most effective.3
There are several types of evaluations including process or implementation studies, impact analyses, and cost-benefit analysis.3 Implementation evaluation (also known as process evaluation) is a descriptive analysis of the execution of program activities. Specifically for WIC, an implementation evaluation can include examining if the WIC activities are implemented as planned.2 An impact analysis focuses on one or more outcomes of the program and usually involves quantitative measures.3 Lastly, cost-benefit analysis is a comparison evaluation on the cost and estimated benefits from the program.3 For example, a WIC agency can determine the cost of increased signage outside of a WIC clinic and compare that to how much it has impacted the program enrollment to see if the cost of the materials and labor is worthwhile based enrollment increases.

Photo source: https://blog.wiziq.com/evaluate-a-training-program/
Why do an evaluation?
Despite an abundance of evidence that WIC is a successful program, it is clear that there is room for improvement in participant recruitment and retention. There is a plethora of ideas about to how to do this by changing the way WIC operates. Throughout its long history, there have been numerous modifications meant to improve its operation and its effectiveness. Many, but not all, of these modifications have been evaluated to determine if effectiveness is indeed improved by their implementation.
These changes, sometimes called interventions, may be small, for example hiring a new staff member, or on a larger scale, for example, instituting a new outreach strategy. If these types of changes are implemented, they are very often not evaluated to determine if they do indeed improve effectiveness. Sometimes, it may appear obvious if a change “worked” or if the change did not work. However, it is most often not clear if changes in the way that a program operates are related to improvements in program effectiveness. Without evaluation, the relationship between project activities and observed outcomes cannot be verified.
Involvement of local WIC agency leadership and staff in evaluation
While there does not appear to be any published literature on the involvement of local WIC agency staff in research and evaluation, there has been some focus on the involvement of community health workers in community-based research studies,4 5 and several studies have explored the role of other USDA-funded nutrition educators in evaluation.6 7 This literature demonstrates the importance of engaging local public health workers in evaluation and the need for more training and support for these activities.
References
- Caulfield LE, Bennett WL, Gross SM, Hurley KM, Ogunwole SM, Venkataramani M, Lerman JL, Zhang A, Sharma R, Bass EB. Maternal and Child Outcomes Associated With the Special Supplemental Nutrition Program for Women, Infants, and Children (WIC). Comparative Effectiveness Review No. 253. (Prepared by the Johns Hopkins University Evidence-based Practice Center under Contract No. 75Q80120D00003.) AHRQ Publication No. 22-EHC019. Rockville, MD: Agency for Healthcare Research and Quality; April 2022. DOI: https://doi.org/10.23970/AHRQEPCCER253.
- U.S. Department of Health and Human Services Centers for Disease Control and Prevention. Office of the Director, Office of Strategy and Innovation. Introduction to program evaluation for public health programs: A self-study guide. Atlanta, GA: Centers for Disease Control and Prevention, 2011. https://www.cdc.gov/evaluation/guide/CDCEvalManual.pdf.
- United States Department of Agriculture (USDA) Food and Nutrition Service (FNS) (1991). WIC Evaluation Resource Guide. https://fns-prod.azureedge.net/sites/default/files/WICEvaluationResourceGuide.pdf.
- Ingram, M., Chang, J., Kunz, S., Piper, R., de Zapien, J. G., & Strawder, K. (2016). Women’s Health Leadership to Enhance Community Health Workers as Change Agents. Health Promotion Practice, 17(3), 391–399. https://www.jstor.org/stable/26734030.
- Nebeker C, López-Arenas A. Building Research Integrity and Capacity (BRIC): An Educational Initiative to Increase Research Literacy among Community Health Workers and Promotores. J Microbiol Biol Educ. 2016 Mar 1;17(1):41-5. doi: 10.1128/jmbe.v17i1.1020. PMID: 27047588; PMCID: PMC4798813.
- Tisa Fontaine Hill, Christina M. Stark, Deborah E. Sellers, Jamie S. Dollahite, Training Needs of Nutrition Educators Engaged in Policy, Systems, and Environmental Approaches, Journal of Nutrition Education and Behavior, Volume 52, Issue 12, 2020, Pages 1131-1138, ISSN 1499-4046, https://doi.org/10.1016/j.jneb.2020.07.007. https://www.sciencedirect.com/science/article/pii/S1499404620305224.
- Franck, K. (2016). 2016 Delphi Study Summary: Barriers, Facilitators, and Training Needs for Successful PSE Implementation in SNAP-Ed and EFNEP. https://snapedpse.org/wp-content/uploads/2017/08/RNECE-PSE-Delphi-summary-2016.pdf.
Developing an Evaluation Plan
How do I conduct an evaluation? Start with a plan.
Contemplating evaluation may cause anxiety, especially if it is the first time you have thought about it. It may require you to look at your Program differently than how you do now. It does require a plan. The plan is a set of procedures that lays out what needs to be done to complete an evaluation. It is a written document that describes how you will monitor and evaluate your program, so that you will be able to describe the “What”, the “How”, and the “Why It Matters” and use evaluation results for program improvement and decision making.
The steps:
- Define the problem. Let’s say you know your Program has a retention problem. This step will require you to understand the magnitude of the problem. For example, use your data source to determine how many infants are enrolled in the program and how many re-enroll at age 1, age 2, age 3 and age 4. What is the decline in participation over this time period?
- Describe how you propose to address the problem. What is your intervention?
- What do you want to accomplish? What are your objectives? Remember to be SMART! Your goals must be specific, measurable, achievable, relevant, and time-based. For example, transform the following information into a goal or goals: improve retention of 3-year-old WIC participants; using data abstracted from the WIC administrative data base; why is this achievable? how do the goals address the problem? When will the goal be accomplished?
- Logic model: come on, you got this! (See How to Develop a Logic Model in Project Development.)
- Pretesting or piloting: How will you pretest your intervention? Following the pretest, what are your results, lessons learned, and planned modifications prior to full scale implementation?
- The work plan: Who will do it? How will they do? When will they do it?
- Timeline: List when project activities will be started and completed
- Training Materials: Describe the training materials that you will use and/or develop for staff and clients related to implementing your project
- Implementation Protocols: Describe the protocols you will develop related to implementing your project
- Evaluation Questions: List the questions you would like to answer through the evaluation of your project. These should be related to your SMART Objectives and your Logic Model. The questions will differ based on if they correspond to a process evaluation (questions will relate more to feasibility and acceptability of the intervention) or outcome evaluation (questions will relate more to impacts of the intervention).
- Evaluation Design: Describe your evaluation design. Is it pre/post (adequacy, plausibility)?
- Data Collection Plan: Describe what specific data you will collect and why, how often you will collect it, and who will collect it
- Data Collection Instruments: Describe the instruments that you will use to collect data and what type of data each instrument will collect
- Data Collection Protocols: Describe the protocols that you will develop so data can be collected consistently
- Data Management and use: Describe how you will manage your data, including how you will ensure privacy and security of the data.
- Data Analysis Plan: Describe each analysis you plan to do, including how it will be done, who will do it, why they will do it, and when they will do it.
We have included a sample evaluation plan (created by Pima County WIC in Arizona) for your reference.
Data Collection: Surveys
To evaluate an innovative project, it is often important to conduct a survey of various stakeholder groups. Surveys can assess satisfaction, impact of the innovation on various self-reported outcomes, knowledge, understanding, and other key measures of how the innovation was received. Pre/post surveys are a popular way of measuring changes in knowledge or perceptions before and after the innovation is implemented.
The first survey instrument included in the resource guide is a simple survey created by Miami-Dade WIC to assess the impact of social media posts on motivation to contact WIC (you can find the response options here ). The survey’s purpose was to capture WIC client engagement with and exposure to social media. The online survey was developed via the SurveyMonkey platform in English, Spanish and Creole. The SurveyMonkey link was included in the standardized email script sent to the authorized representative for all child certifications agency-wide. Improvements to the survey were made after an initial testing period, using SurveyMonkey platform metrics. Grant sponsored incentives were used to motivate staff to promote the survey during virtual certification appointments (via email link), and a local agency contest was implemented to create friendly competition between WIC units.
The second set of survey instruments (three total) were created by Public Health Solutions in New York City. These surveys were for three different audiences (WIC clients, WIC staff, and representatives of partner organizations) and assessed satisfaction, usefulness, and other key outcomes of the innovation. The survey questions and outcomes of interest were targeted to each audience group. The online surveys were built in Alchemer (a survey building software) and distributed via text (client survey) or email (WIC staff and partners). The client survey was made available in the 8 most common languages spoken across the intervention and comparison WIC sites (Arabic, Bengali, Chinese, English, Polish, Russian, Spanish, and Uzbek). The WIC staff and partner surveys were only available in English. Each survey was in the field for at least a week.
Data Collection: Interviews and Focus Groups

Photo source: https://apexfocusgroup.com/
When evaluating an innovation in WIC, focus groups and in-depth interviews can help to supplement the information you collect in the form of surveys and/or using participant data sources like the WIC MIS. Qualitative research helps us dive deeper into particular themes and detect nuances that are not always possible to discern using surveys. Focus groups and interviews can be conducted with different stakeholder groups (such as WIC clients, WIC staff, and others). Focus groups and interviews are conducted by a facilitator or interviewer and will often involve a notetaker as well.
Focus groups tend to be more time-efficient (can speak to multiple people at once) and are good for eliciting responses from different perspectives that can help to build on one another. Interviews are more time-intensive but can be an important source of in-depth information from a particular client or staff member. Also, interviewees may be more willing to share information (particularly of a sensitive nature) in a one-on-one interview than in a focus group setting. Please consult with your local or state agency leadership to see if this type of research at your agency will require the approval of an Institutional Review Board (IRB).
Several sample focus group guides are included in the resource guide. The first is from Pima County WIC in Arizona and was designed to guide conversations with local agency WIC staff about their awareness and perceptions of WICBuzz, Pima County’s drip text messaging campaign. This is an example of a simple focus group guide that allows the focus group facilitator to guide the conversation in an informal way. The next two focus group guides were designed by Public Health Solutions (PHS) in New York City, to guide conversations with WIC staff and partners (respectively). These are examples of slightly more formal guides that include very detailed questions and probes (i.e., follow-up questions to elicit more specific information). Public Health Solutions also created an in-depth interview guide that has been included. This was used to interview WIC clients to explore how the PHS innovative needs assessment conversations were received by clients and if the conversation had any impact on the client’s decision to remain in WIC.
Using MIS to Evaluate Impacts of an Innovation on Participation and Retention
Developing Data Collection Plan
An evaluation study with goals to improve retention of WIC participants and to evaluate a WIC agency’s efforts to develop innovative tools that improve customer service in WIC clinics and their impact on child retention can use MIS data for the outcome evaluation. The best practice for this type of outcome evaluation is a quasi-experimental impact evaluation to measure the overall effect that the innovation had on retention and participation.
MIS data will need to be requested from the state WIC agency which administers the Management Information System (MIS); most data you request will be a part of the USDA/FNS WIC Minimum Dataset (MDS) or Supplemental Dataset (MDS). “The current system for reporting PC data is based on the automated transfer of a set of 20 data items, known as the Minimum Data Set (MDS), by state agencies to FNS. The data items represent information State and local WIC staff collect to confirm applicant eligibility for WIC benefits and issue food instruments. In 1992, FNS developed the MDS in collaboration with the Information Committee of the National WIC Association and the Centers for Disease Control and Prevention (CDC). For PC data reporting, all 89 state agencies are asked to submit the MDS data on a census of participants.” (More information on the MDS can be found at https://fns-prod.azureedge.us/sites/default/files/resource-files/WICPC2020-1.pdf, page 20). It is important to make some decisions about your evaluation study before you make a request for data.
- Identify the population of interest (all participants, pregnant, breastfeeding, postpartum, infants, and/or children)
- Innovation and comparison groups (if the innovation is in one site or one agency, a comparison site or agency should be identified that is comparable to innovation)
- MIS summary data can be used to compare innovation and comparison sites. Such as:
- Caseload
- Distribution of Participant Categories
- Race/ethnicity
- Primary Language other than English
- Use of other Supplemental Assistance Program (SNAP, Medicaid, TANF)
- You may also include non-MIS information in the description of innovation and comparison groups such as geographic location and operations
- MIS summary data can be used to compare innovation and comparison sites. Such as:
For a list of possible covariates (other variables which may influence the outcome such as participant category or race/ethnicity) to be obtained from the MIS, please see Table 1 below. These include variables from the WIC MDS and SDS as well as several variables outside of the WIC MDS/SDS.
Table 1. Variables of Interest for WIC Retention-Related Evaluation Project Variables from WIC MDS or SDS
|
|
|
Additional Variables
|
- Identify the dates of your data needs
- You will want to have a baseline data time period before the innovation occurs and an implementation data time period during the innovation.
- You may consider collecting cohorts of participants for baseline and implementation periods.
- For example, in the HPRIL study there were cohorts for the baseline and implementation time periods which were one year long. In each cohort, each participant was expected to have a current certification at the beginning of the period that would end sometime during the time period as WIC certification periods last one year.
Using MIS Data to evaluate impacts of an innovation on participation and retention: Defining Outcome Measures
MIS data will need to be requested from the state WIC agency which administers the MIS. It is important to make some decisions about your evaluation study before you make a request for data.
- Define outcome measures
- Examples of definitions used by HPRIL
- Retention
- Recertification within 14 months of previous certification
- MIS data used
- End date of participant Certification Period during time period of interest (baseline or implementation)
- Recertification Date of participant during time period of interest. (baseline or implementation)
- Status of participant at the end of the period of interest (this is determined by the state agency)
- Active or Not Active
- MIS data used
- Participation measured by benefit issuance and benefit non-use (i.e., expired benefits).
- Benefit issuance
- MIS data
- Benefits issued to participant (yes/no) for each month during time period of interest
- MIS data
- Benefit redemption
- MIS data
- Participants who are actively participating in WIC are issued monthly benefits and redeem at least some of their benefits each month at one or more WIC-approved retailers.
- If a participant receives benefits, these benefits may expire at the end of the month, meaning the participant did not redeem any benefits.
- MIS data
- Benefit issuance
- Use of WIC participant service visits or other contacts
- Midway through the certification period (at roughly six months into the current certification period) there would be a mid-certification appointment, and in between the mid-certification appointment and the certification/recertification appointments (at roughly 3 months and 9 months) there are expected nutrition education and/or participant services visits.
- Recertification within 14 months of previous certification
- See Sample Codebook in the Resource Guide which provides a description for state MIS administrator to pull the data requested
- See Tables 2 and 3 below for a list of definitions that HPRIL used for retention and participation
Table 2. HPRIL Definitions of Indicators Associated with Child Retention
|
Indicator |
Description |
|
Recertification |
The proportion of children in the dataset with a recertification date during the period. Note: includes children who left the agency and/or were not classified as “active” at the end of the period. |
|
Timely recertification |
The proportion of children (out of all children in the cohort) with a recertification date less than or equal to 60 days after the end of certification during the period. |
|
Not-timely recertification |
The proportion of children (out of all children in the cohort) with a recertification date greater than 60 days after the end of certification during the period. |
|
Recertification but lack of retention |
The proportion of children (out of all children in the cohort) with a recertification date during the period who are no longer active at the end of the period. |
|
Percent of recertifications that are timely |
The proportion of children (only out of those with a recertification date) whose recertification date is less than or equal to 60 days after the end of the certification during the period. |
|
Retention |
The number of children active at the end of the data period at the innovation or comparison agency / (The number of children overall at the beginning of the period - children at another local agency at the end of the period) |
Table 3. HPRIL Definitions of Indicators Associated with Child Participation
|
Indicator |
Description |
|
Months of benefit issuance |
Months of benefit issuance (out of 12) for each child. |
|
Months of benefit issuance (percent of calendar year) |
The proportion of children with 100% of benefits (i.e., 12 months); 75%-<100% of benefits (i.e., between 9 and 11 months); 50%-<75% of benefits (i.e., between 6 and 8 months); and <50% of benefits (i.e., between 0 and 5 months). |
|
Ever issued benefits in the three months prior to end of certification |
For each activity group, the proportion of children issued benefits (a dichotomous variable – yes or no) in any of the three months prior to the end of certification. |
|
Ever issued benefits in the three months after recertification date |
For each activity group (except the not active, not recertified group), the proportion of children issued benefits (a dichotomous variable – yes or no) in any of the three months after their recertification date. |
|
Ever issued benefits in the last three months of the calendar year |
For each activity group, the proportion of children issued benefits (a dichotomous variable – yes or no) in any of the three months at the end of the calendar year (October-December). |
|
Benefit non-use |
Proportion of children in each month of the baseline period with fully expired benefits (only among children who were issued benefits that month). |
Using MIS Data to evaluate impacts of an innovation on participation and retention: Requesting data and creating database
An outcome measures database should consist of de-identified data from baseline and implementation period. This data will need to be cleaned and analyzed at baseline to compare subjects within and between each group on participant characteristics. Compare differences between intervention and comparison in changes in retention rates.
The data request to the state agency should at a minimum include the following:
- The name(s) of the target WIC agencies
- Dataset start date
- Dataset end date
- Dates for re-certification (these dates may start a few months before the start date and end a few months after the end date of the time periods if retention is an outcome and timely recertification is 14 months after start of certification period)
- The birthdates of participants to be included in the dataset (especially if interested in infants and children)
- File format guidance
- For example, HPRIL used wide format CSV file with each row corresponding to one child participant and each column corresponding to MIS descriptive variables and WIC activity variables during the dataset timeframe.
- Please see a skeleton database template created by HPRIL.
- Codebook
- Codebook should contain instructions regarding datafile naming and de-identification of personal identifying information (PII).
- Please see the HPRIL codebook example
- Data Transfer
- Information on how data should be transferred or uploaded to a secure folder
- Datasets should not be emailed
- Contact information
A sample data request letter to the state agency can be found here (this was sent to the North Carolina state WIC office to request a baseline dataset for Cabarrus Health Alliance WIC). It will be important to identify a state or local agency data scientist/analyst who will be helping you obtain the data, cleaning the data, checking the data for completeness and then suggesting a statistical analysis plan for assessing your evaluation goals. If you do not have a data scientist available, data cleaning and checking can be done in excel and you can run some preliminary data analyses for data description in excel (see Basic Analysis with MS Excel Section below).
Data checking includes checking that the data set received from the state agency contained information pertaining to the desired subset of participants, that the coding aligned with your definitions, and that there are no outliers or illogical values, (for example, an end date of an certification period is before the start date of the period or the age of child participant is greater than 5 years old).
Basic Data Analysis with MS Excel
As was previously discussed, evaluating your project is critical to ensure that it does what you want it to do. To accomplish this, you must analyze your data. You are most likely not a trained data analyst, and maybe have no experience in it whatsoever. This section of this guide is not a lesson in evaluation but includes the first few steps. There are many software programs that are used to analyze data, some more sophisticated than others. Excel is a Microsoft software program that uses spreadsheets to organize numbers and data and can assist you in data analysis.
If you have access to Microsoft software, you will be able to access Excel. In order to perform data analysis in Excel, you need to load the Analysis ToolPak.
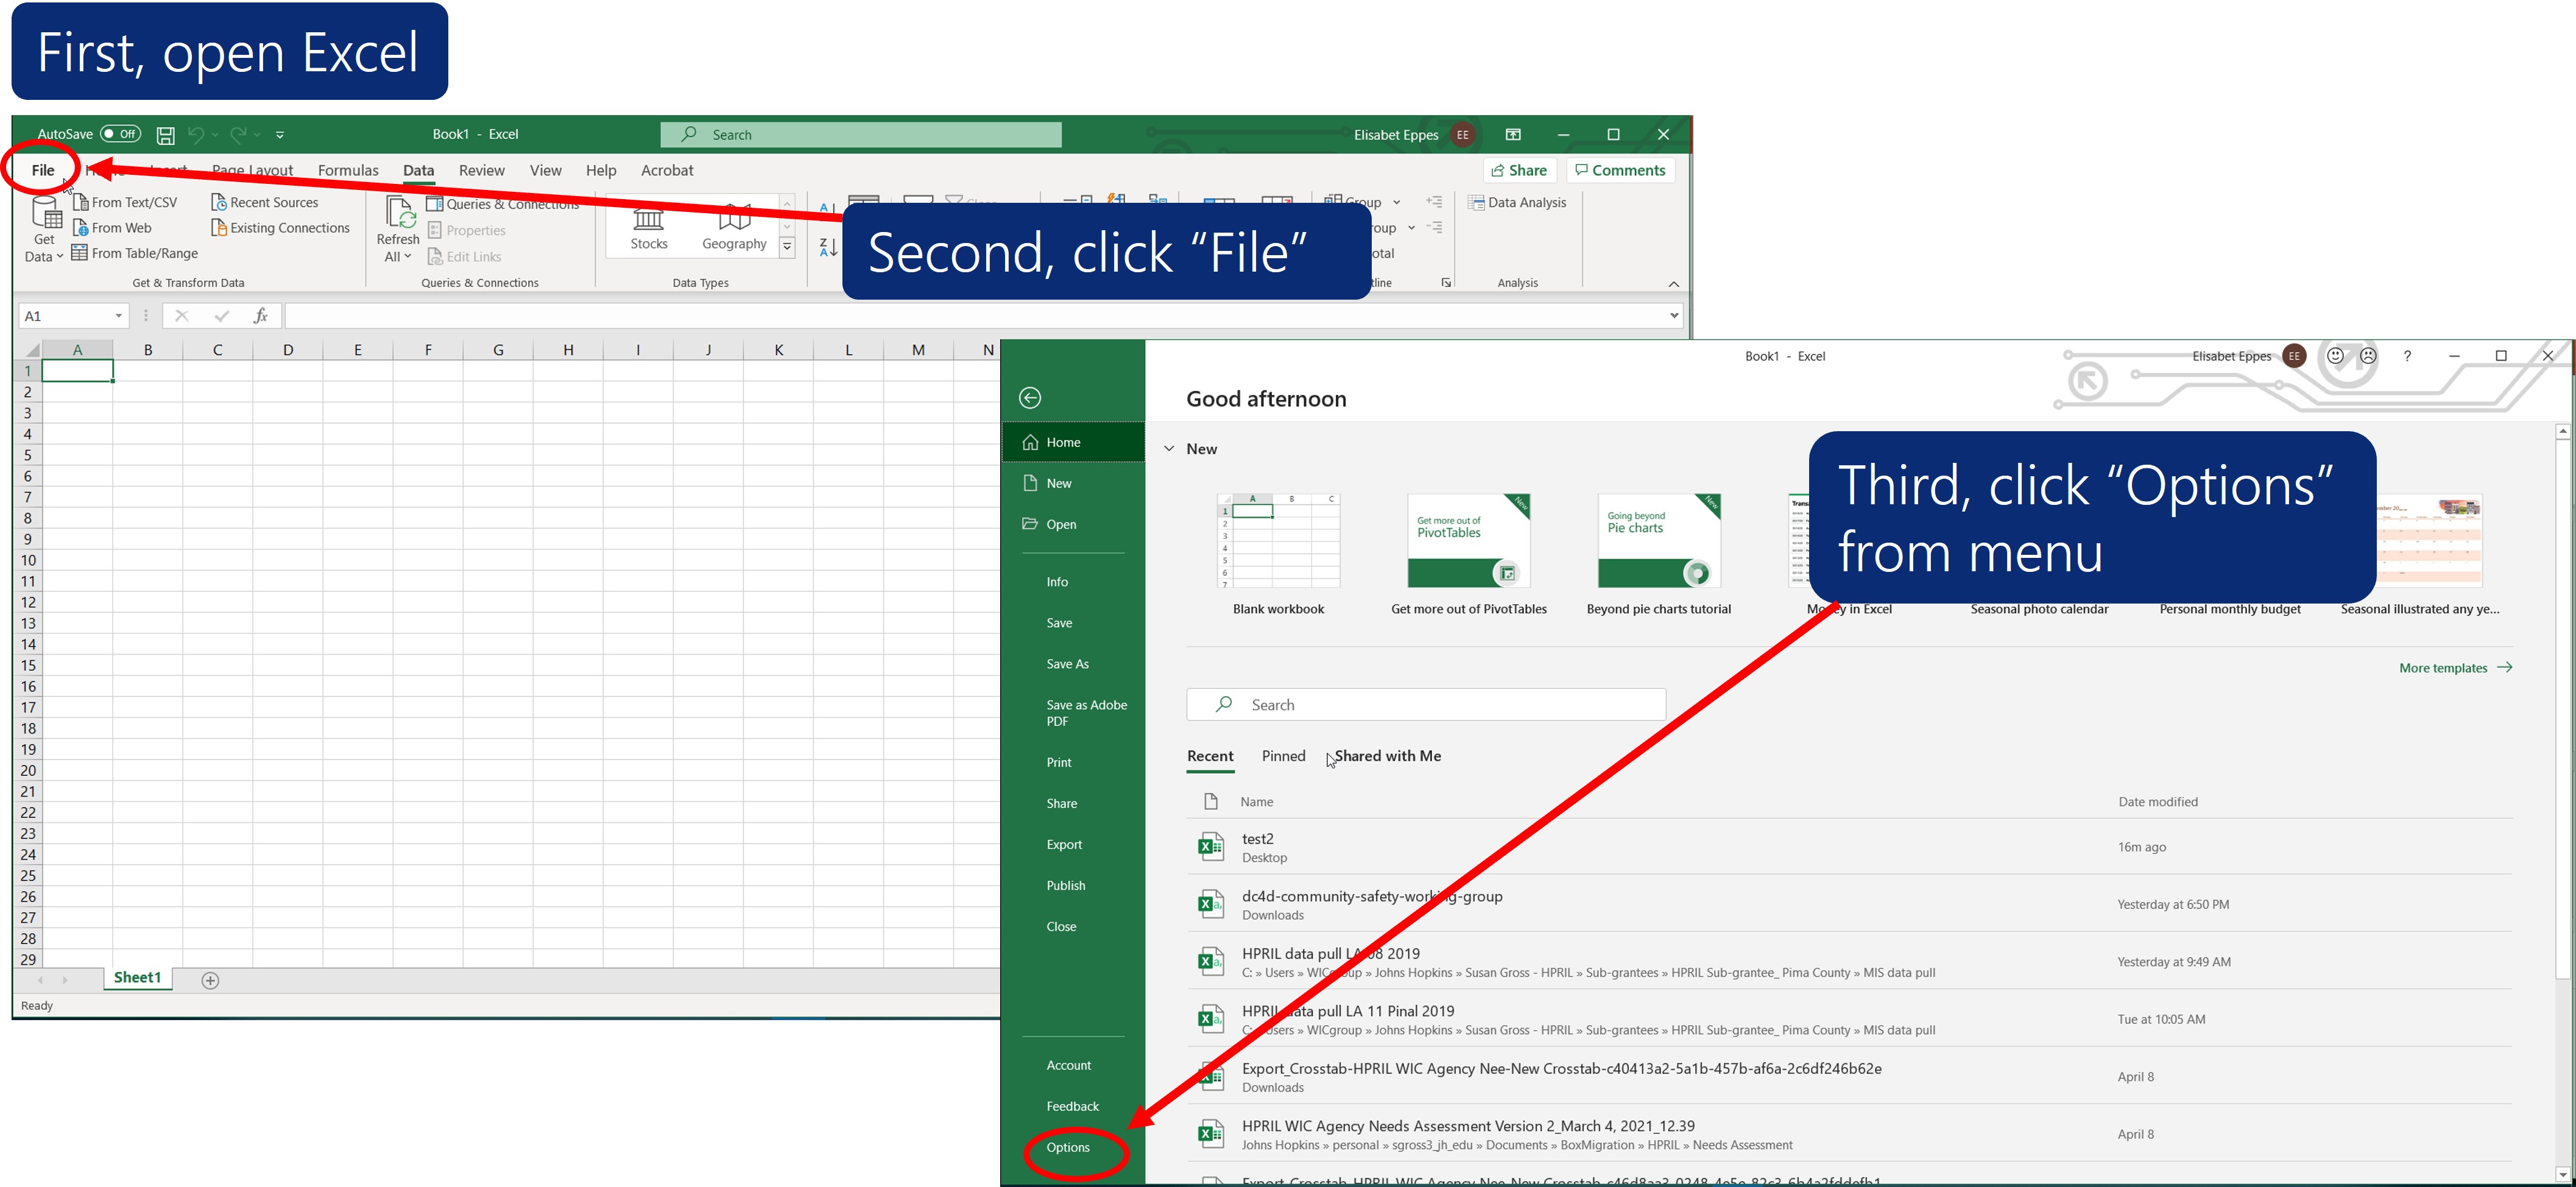
1. Open Excel to the page with the data that you inputted.
2. Click the File tab (top left), click Options (bottom left), and then click Add-Ins (from the menu on the left side.
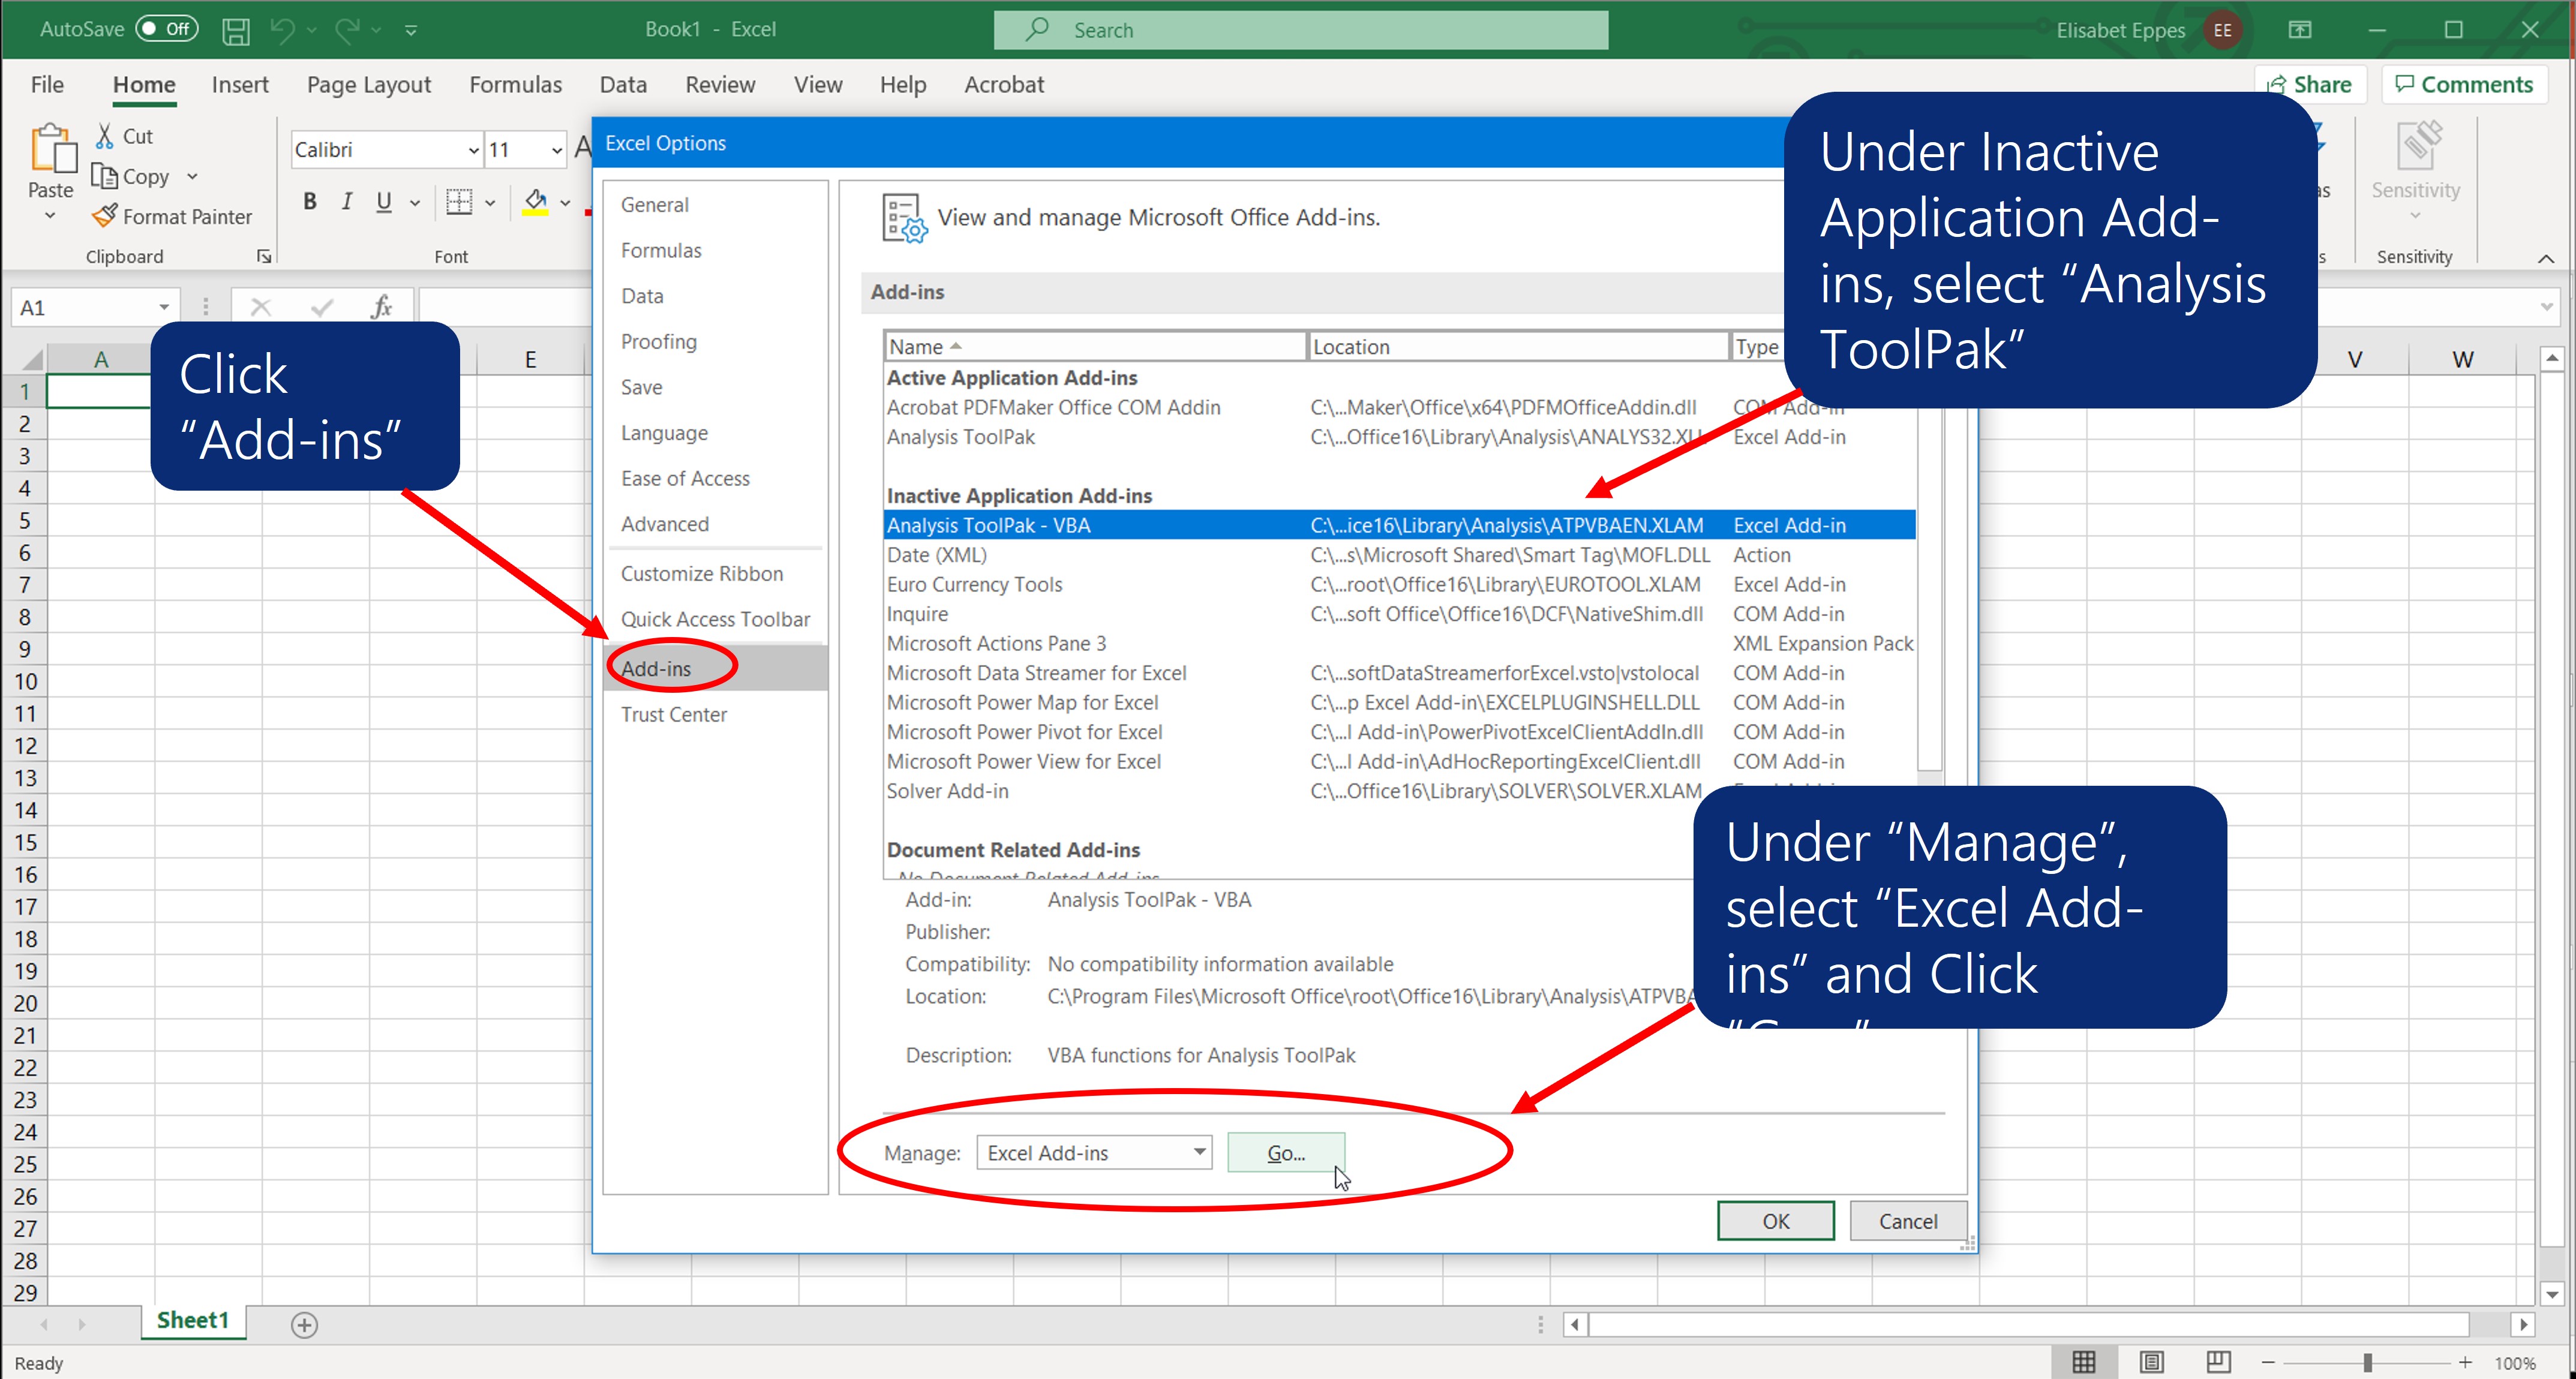
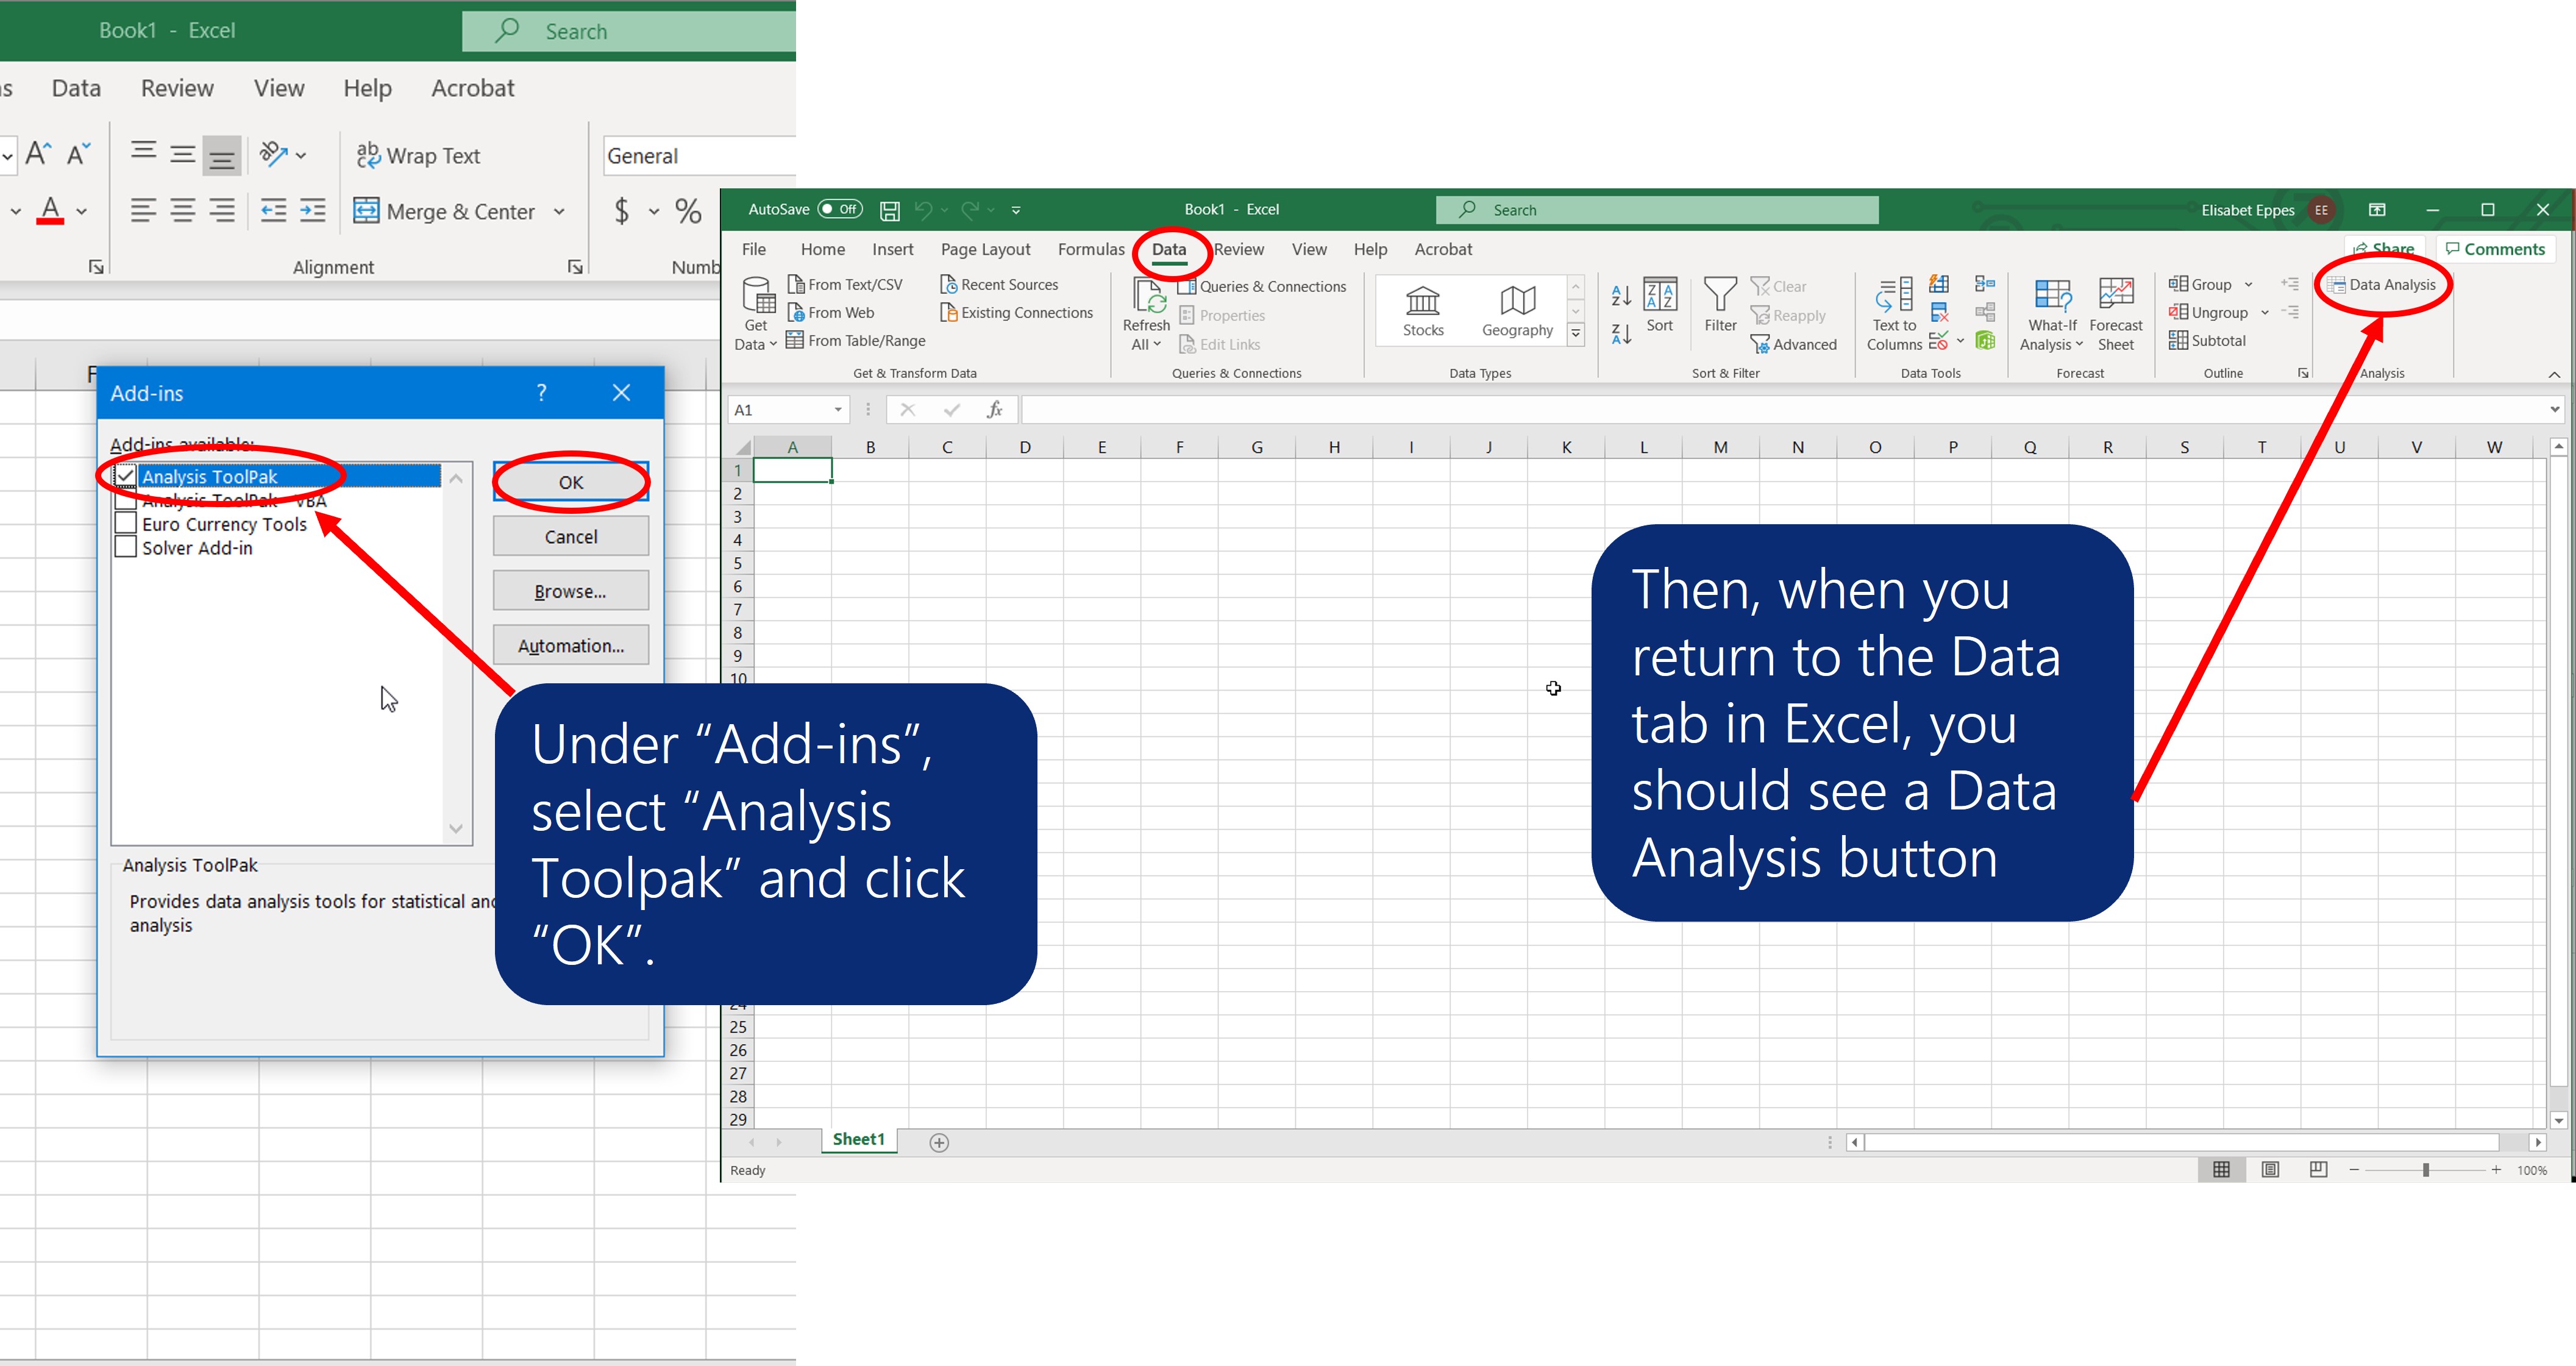
3. From the menu in the middle of the page, under Inactive Application Add-ins, check the Analysis ToolPak box and click Go. If you are prompted that the Analysis ToolPak is not currently installed on your computer, click Yes to install it.
4. From the menu, check Analysis ToolPak. You will then return to the main page. Click the Data tab and on the upper right side of the page, you will see Data Analysis. When you click on it, a menu pops up with what may be a list of unfamiliar terms.
So, now that you have it, how do you use it? Some, but not all, of the methods are relevant to your analysis. Which ones should you use? Start this way:
1) Think back to why you want to do this analysis. Your goal is to compare two or more groups. Here are some examples: Intervention and Control; or Geographical Locations (e.g., urban and rural areas); or people who responded to your survey and those who didn’t.
2) Let’s compare Intervention and Control. For example, you want to know if clients in your intervention site/clinic/agency have a better perception of WIC after the intervention than those in the control site/clinic/agency. Let’s say that you have collected data from both groups by asking them to complete a survey. First thing to do is a relatively “simple” comparison of the measures between the two groups. To do this, you will use Descriptive Statistics.
Descriptive Statistics
1) Open the Excel workbook with the data that you want to use.
2) Click on a single cell of the column you want to sort.
3) Click on the Data Tab at the top of the page.
4) Click on Sort and choose Sort Z-A
5) All your Intervention data will be listed first, followed by the control data.
Now you are ready to start your Data Analysis.
1) Click the Data Analysis list and select Descriptive Statistics.
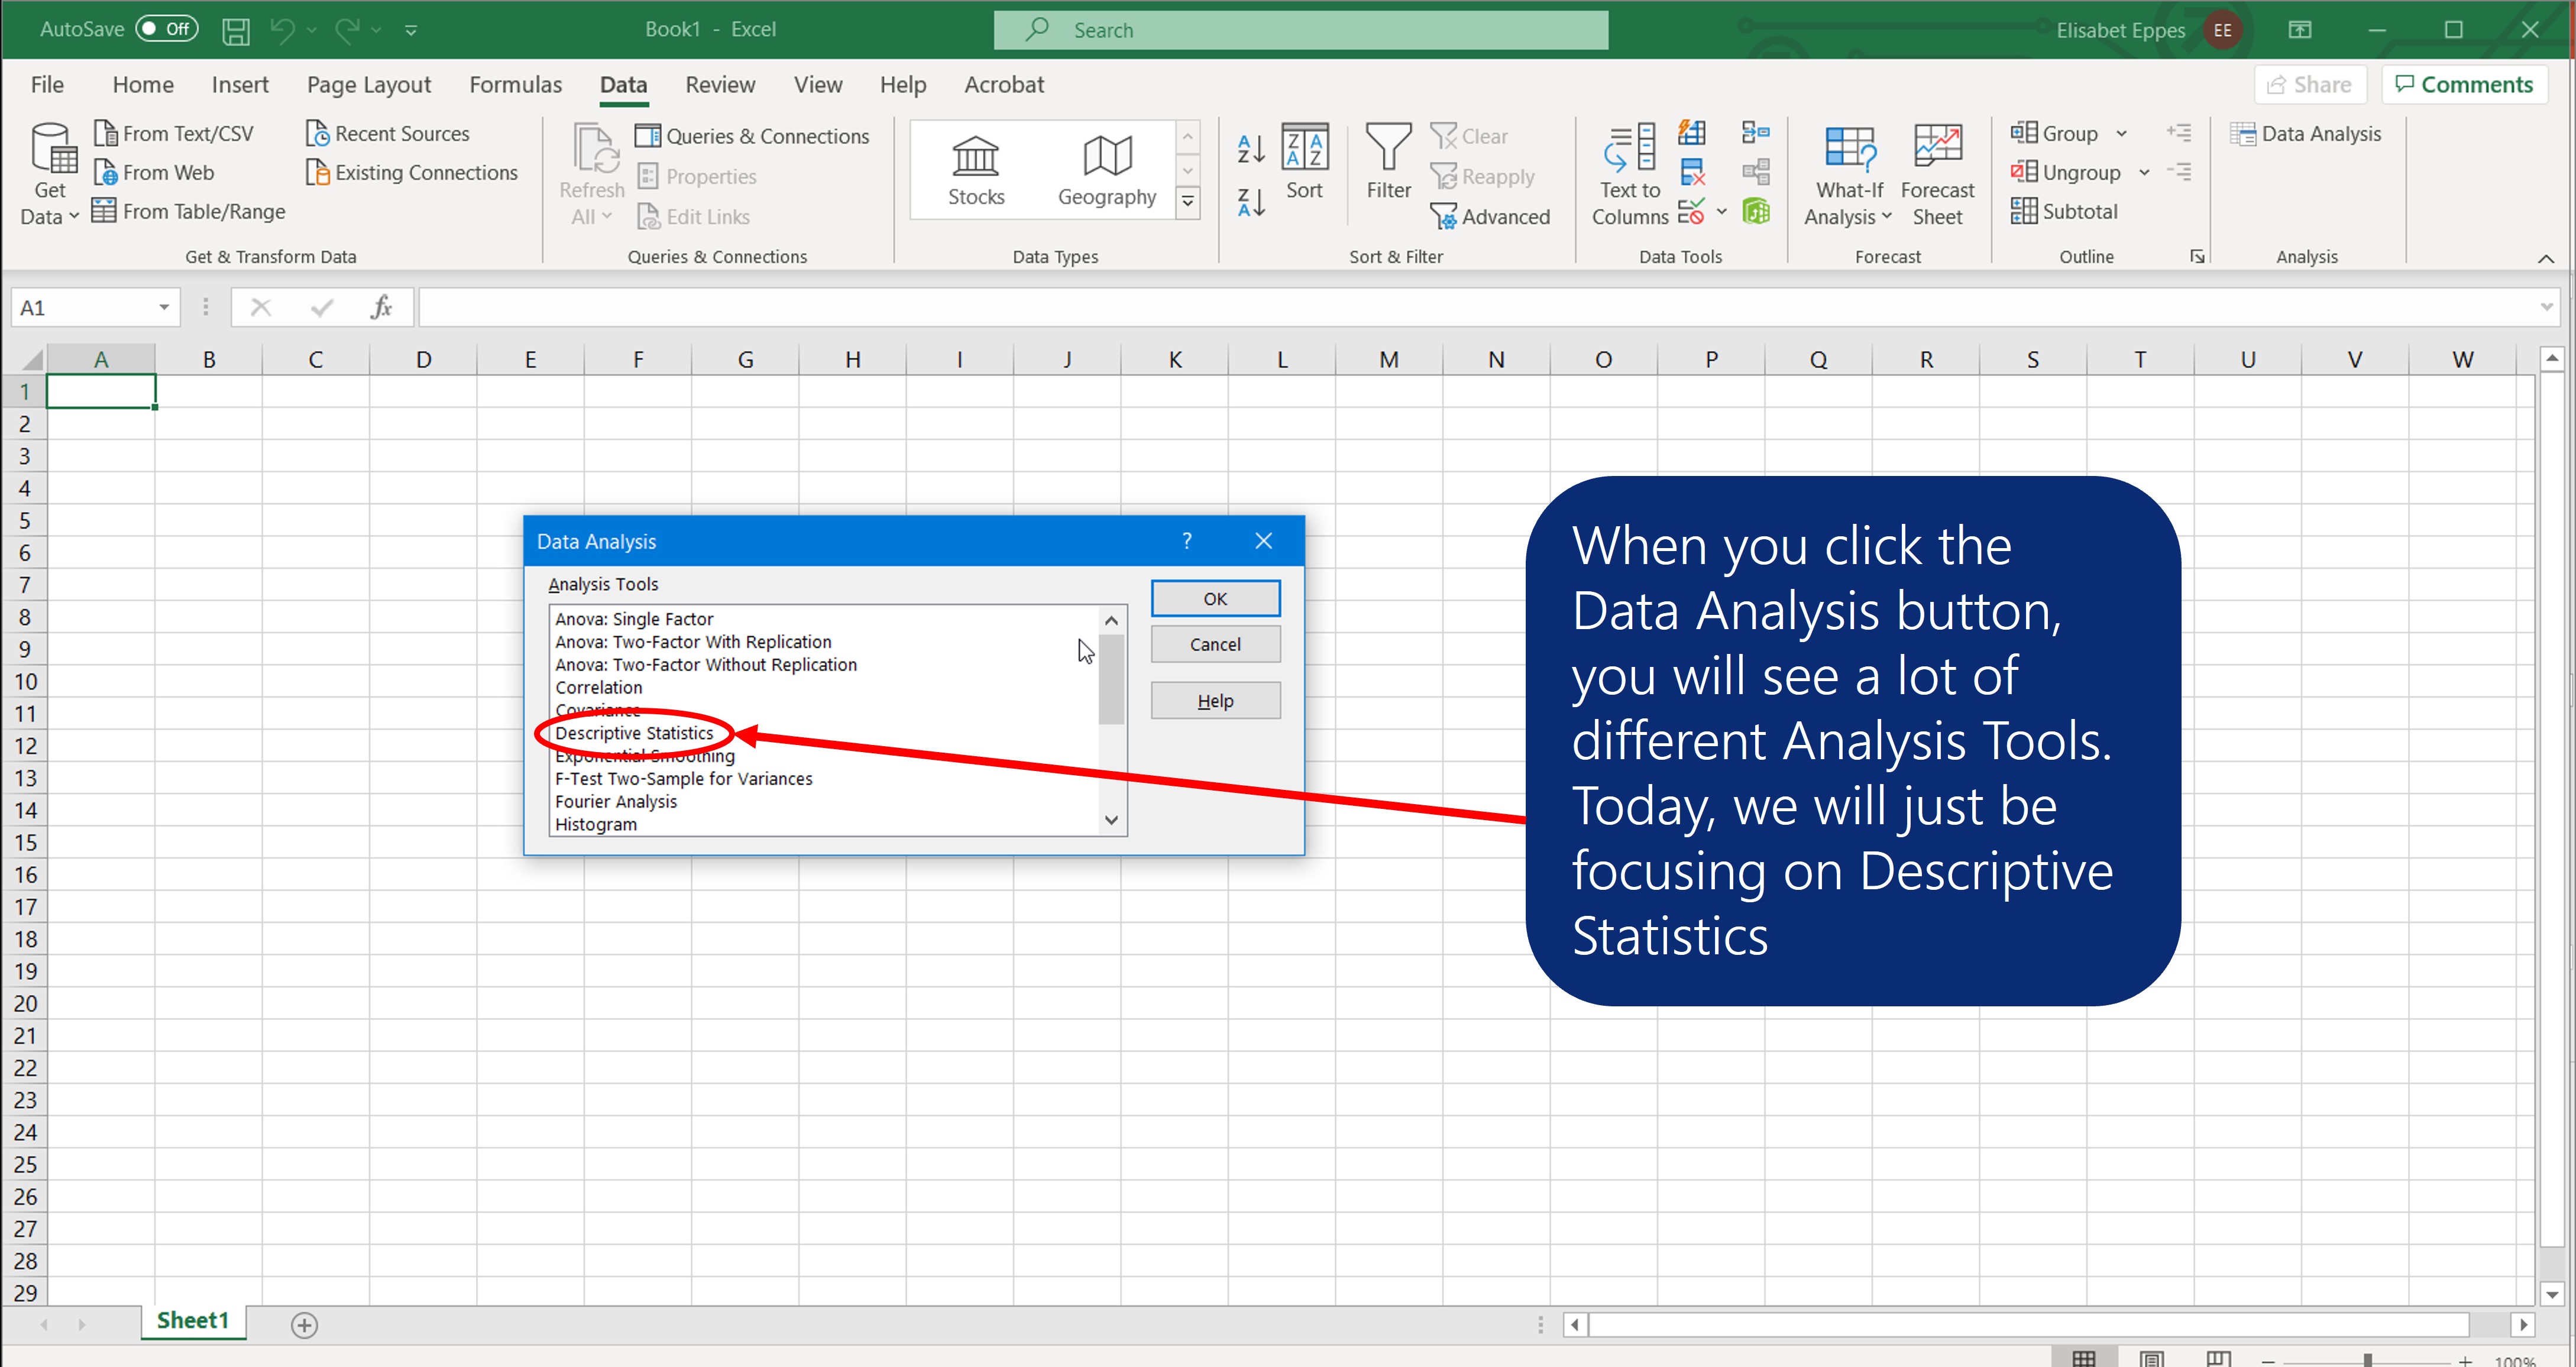
2) A box will come up in the middle of the page.
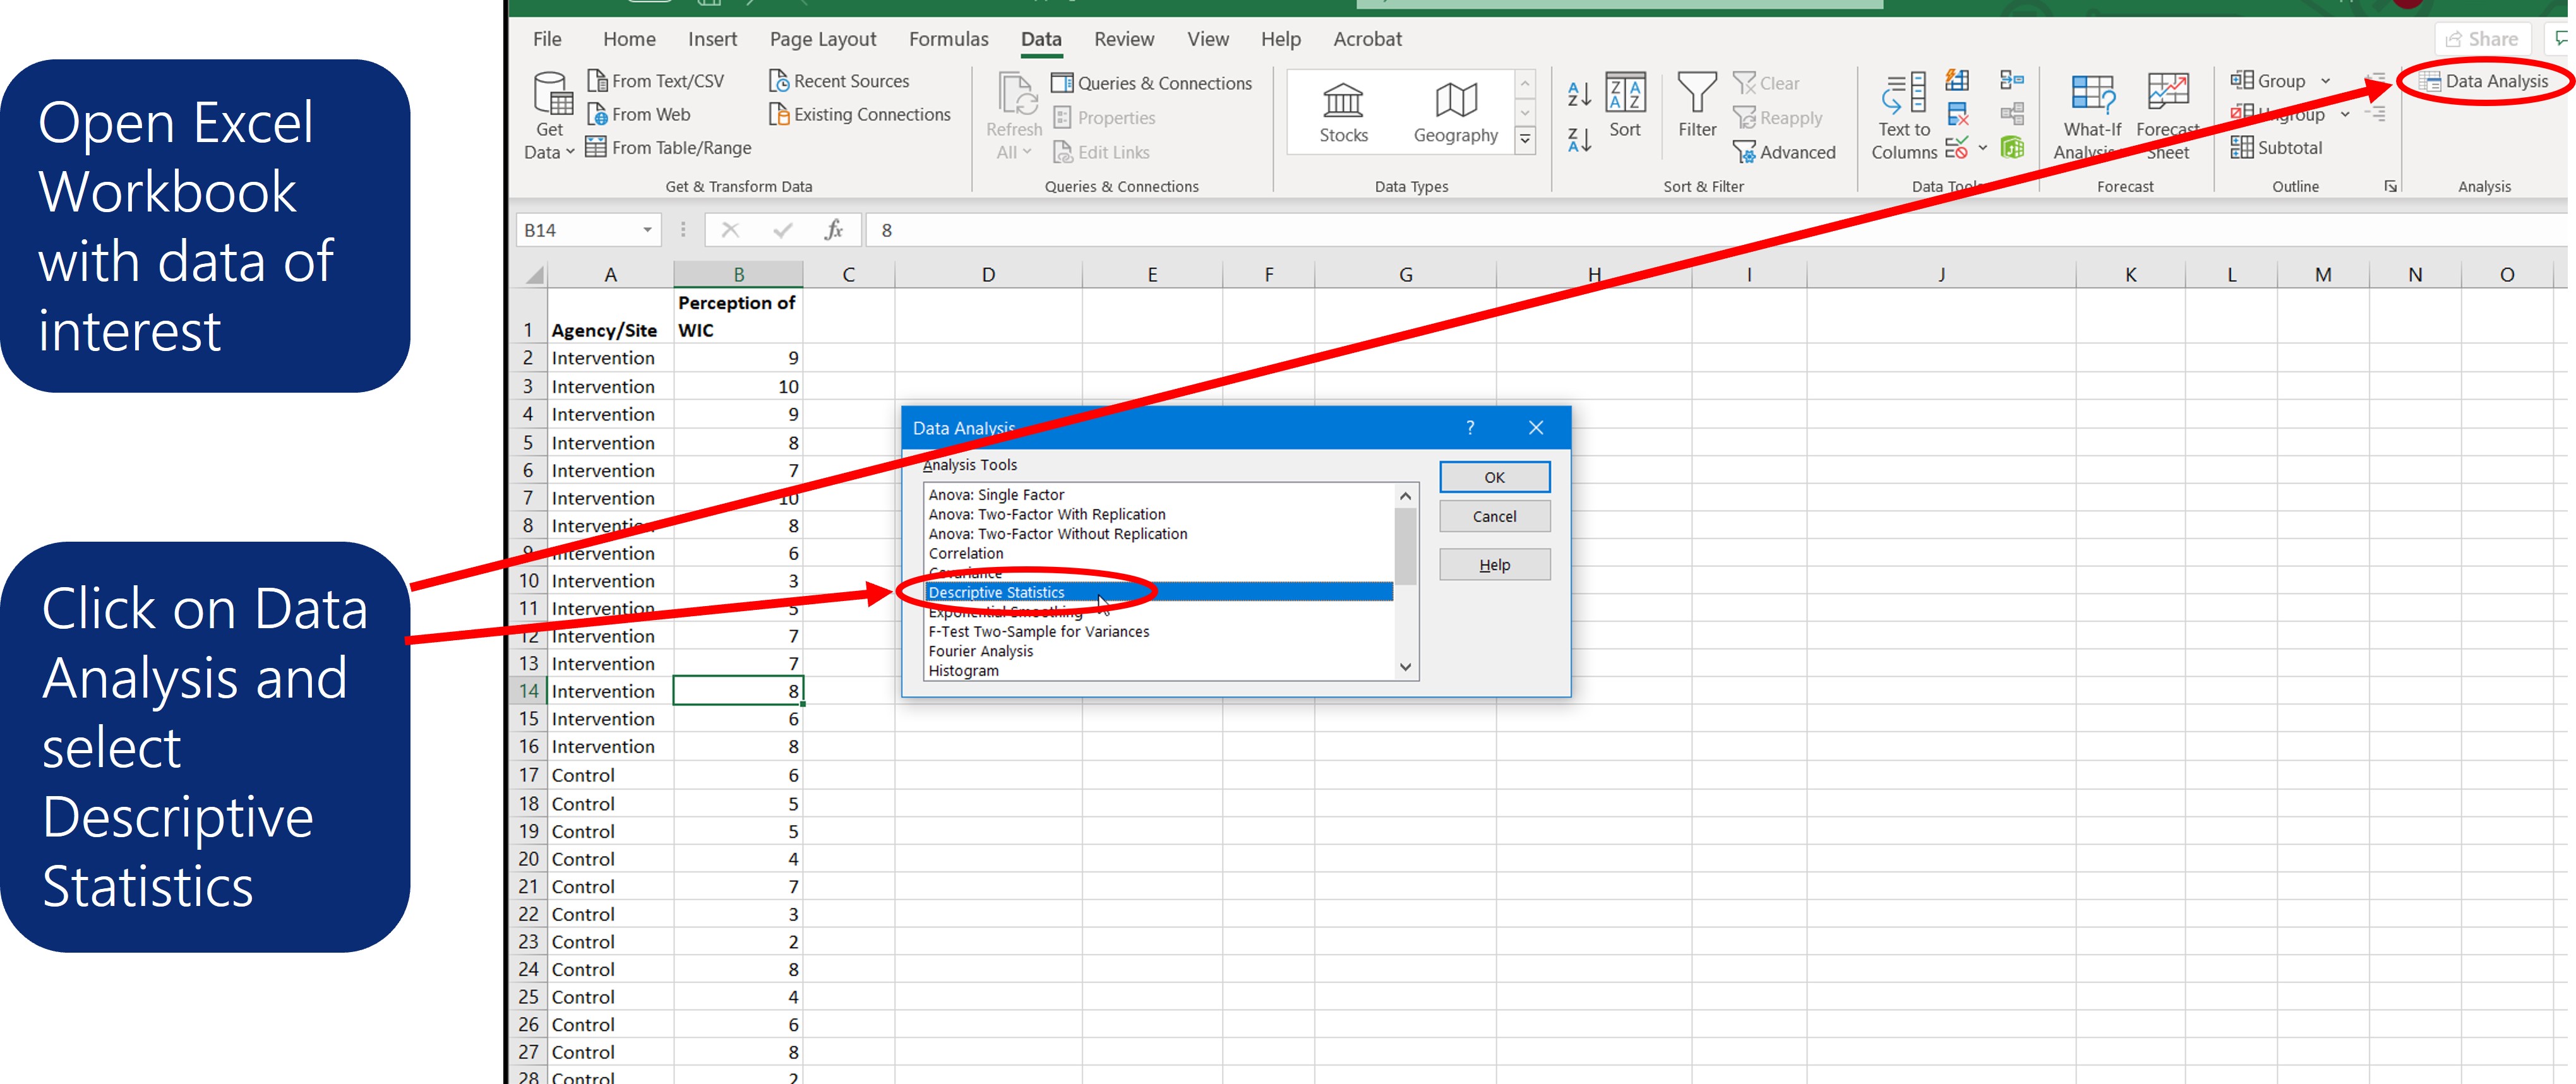
3) Highlight only the Intervention responses for the Input Range and click OK.
4) The Input Range box will be filled.
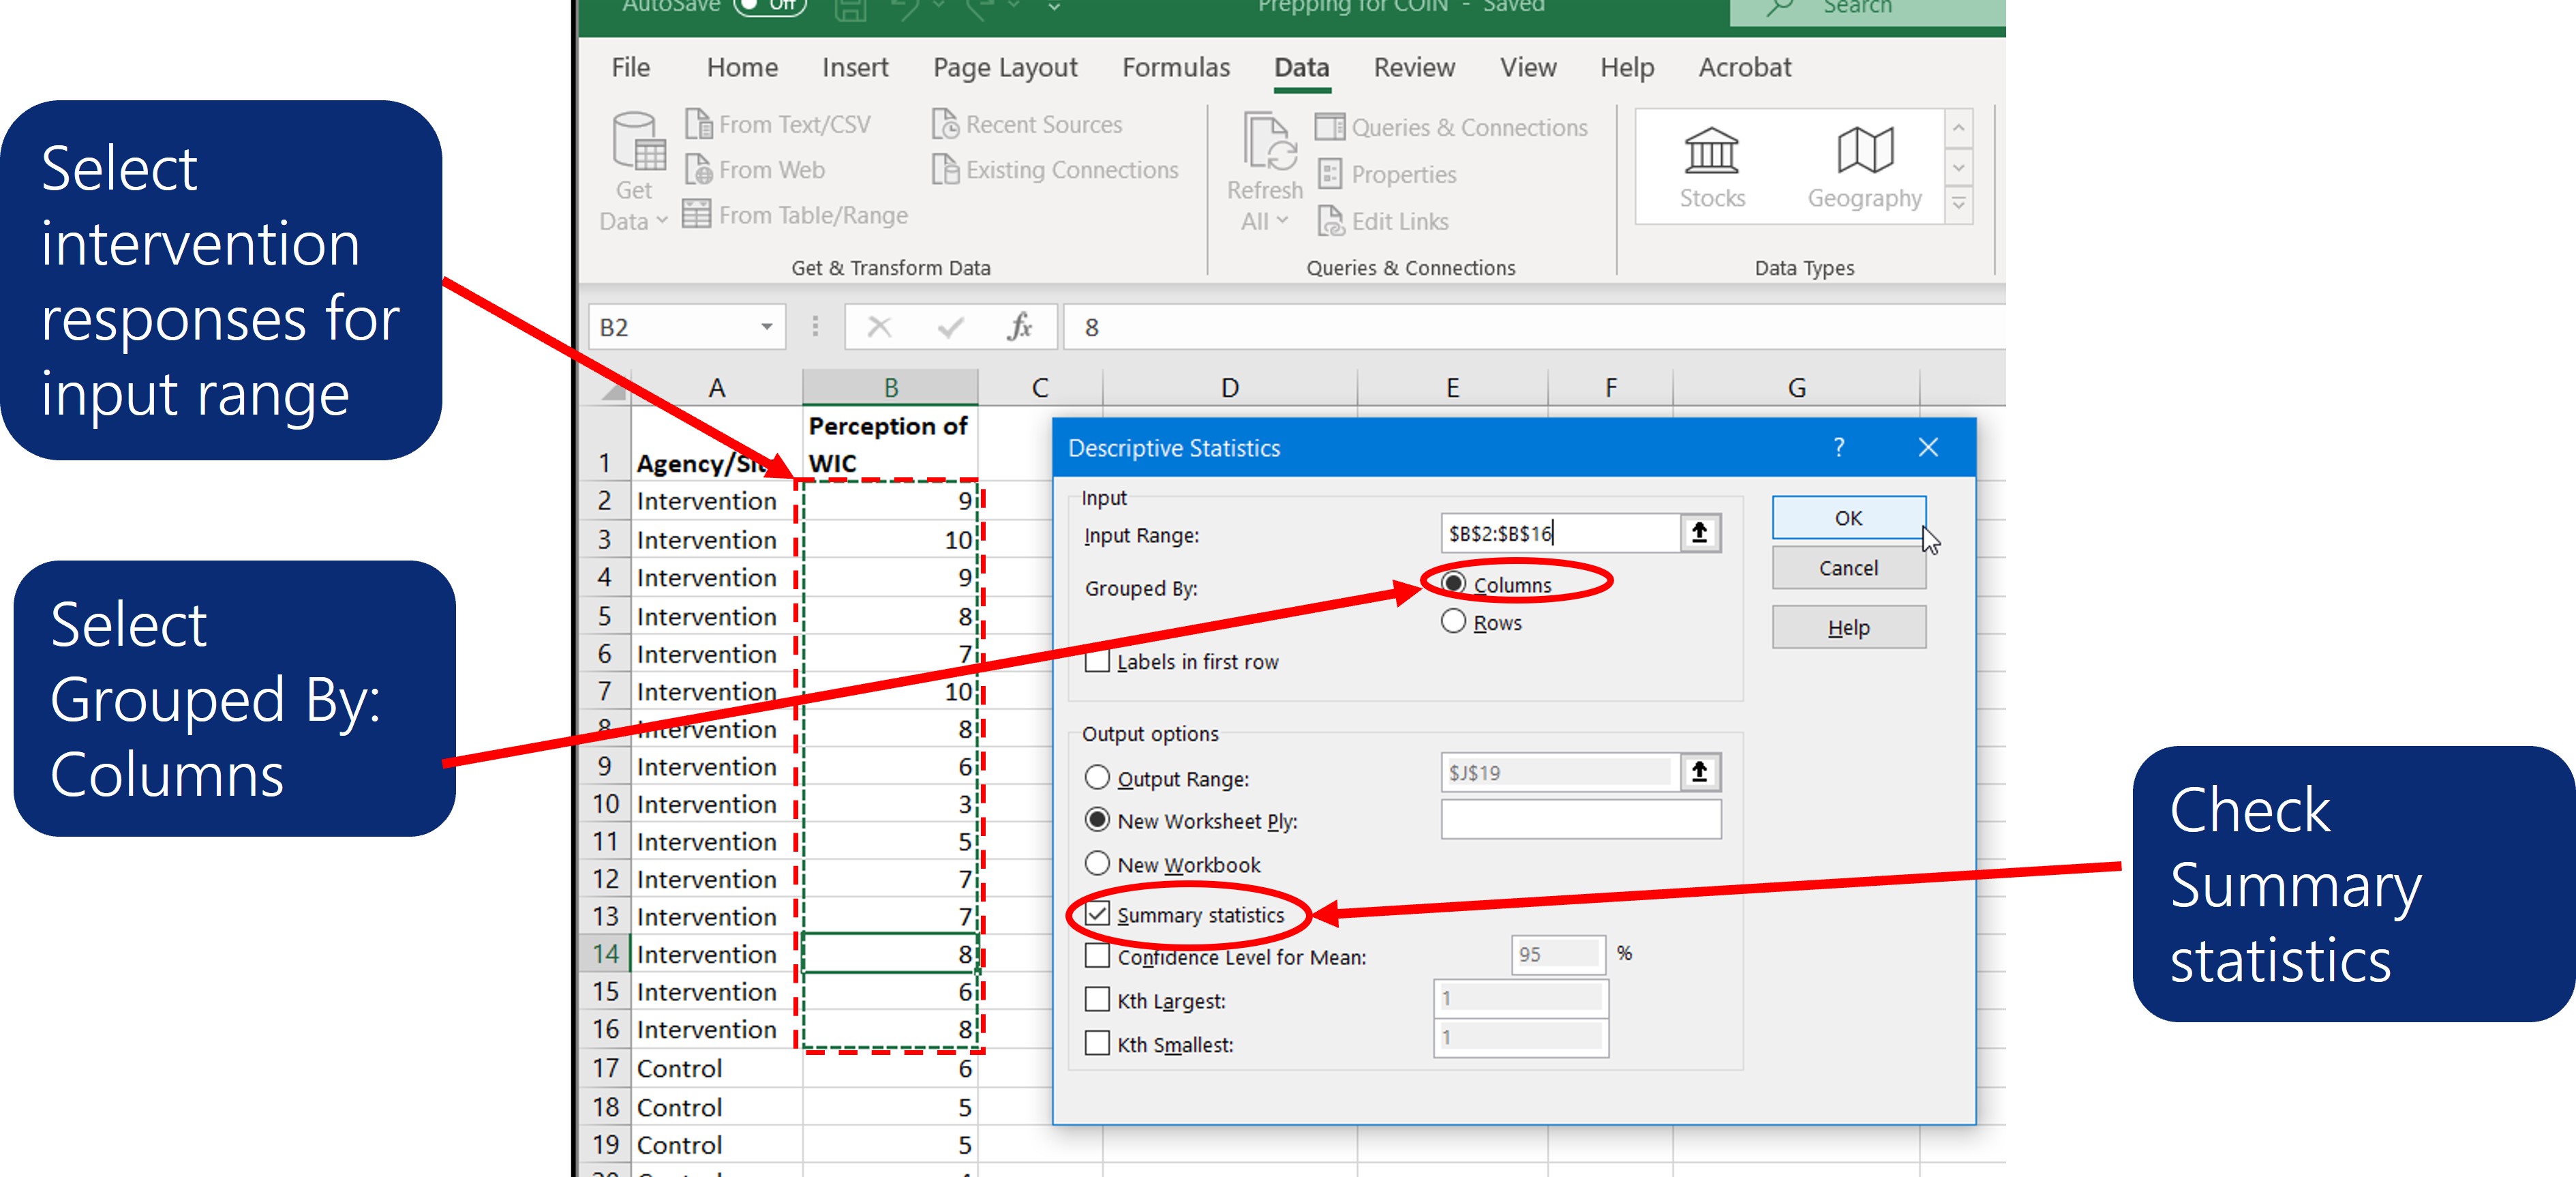
5) Under Input Range, check Grouped by Columns.
6) Further down in the box, under Output Options, check New Work Sheet and Summary Statistics.
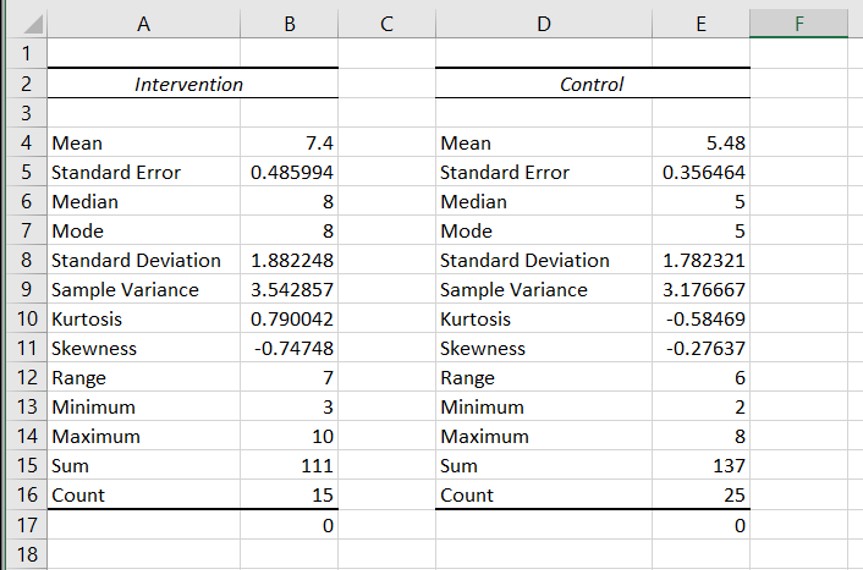
7) On the New Work Sheet will be a column with a list of statistics, including mean, median, mode, standard deviation, range and sum. There will be other items in the list, which may or may not be relevant to your analysis.
8) Repeat the process with the Control Responses, but do NOT select New Work Sheet.
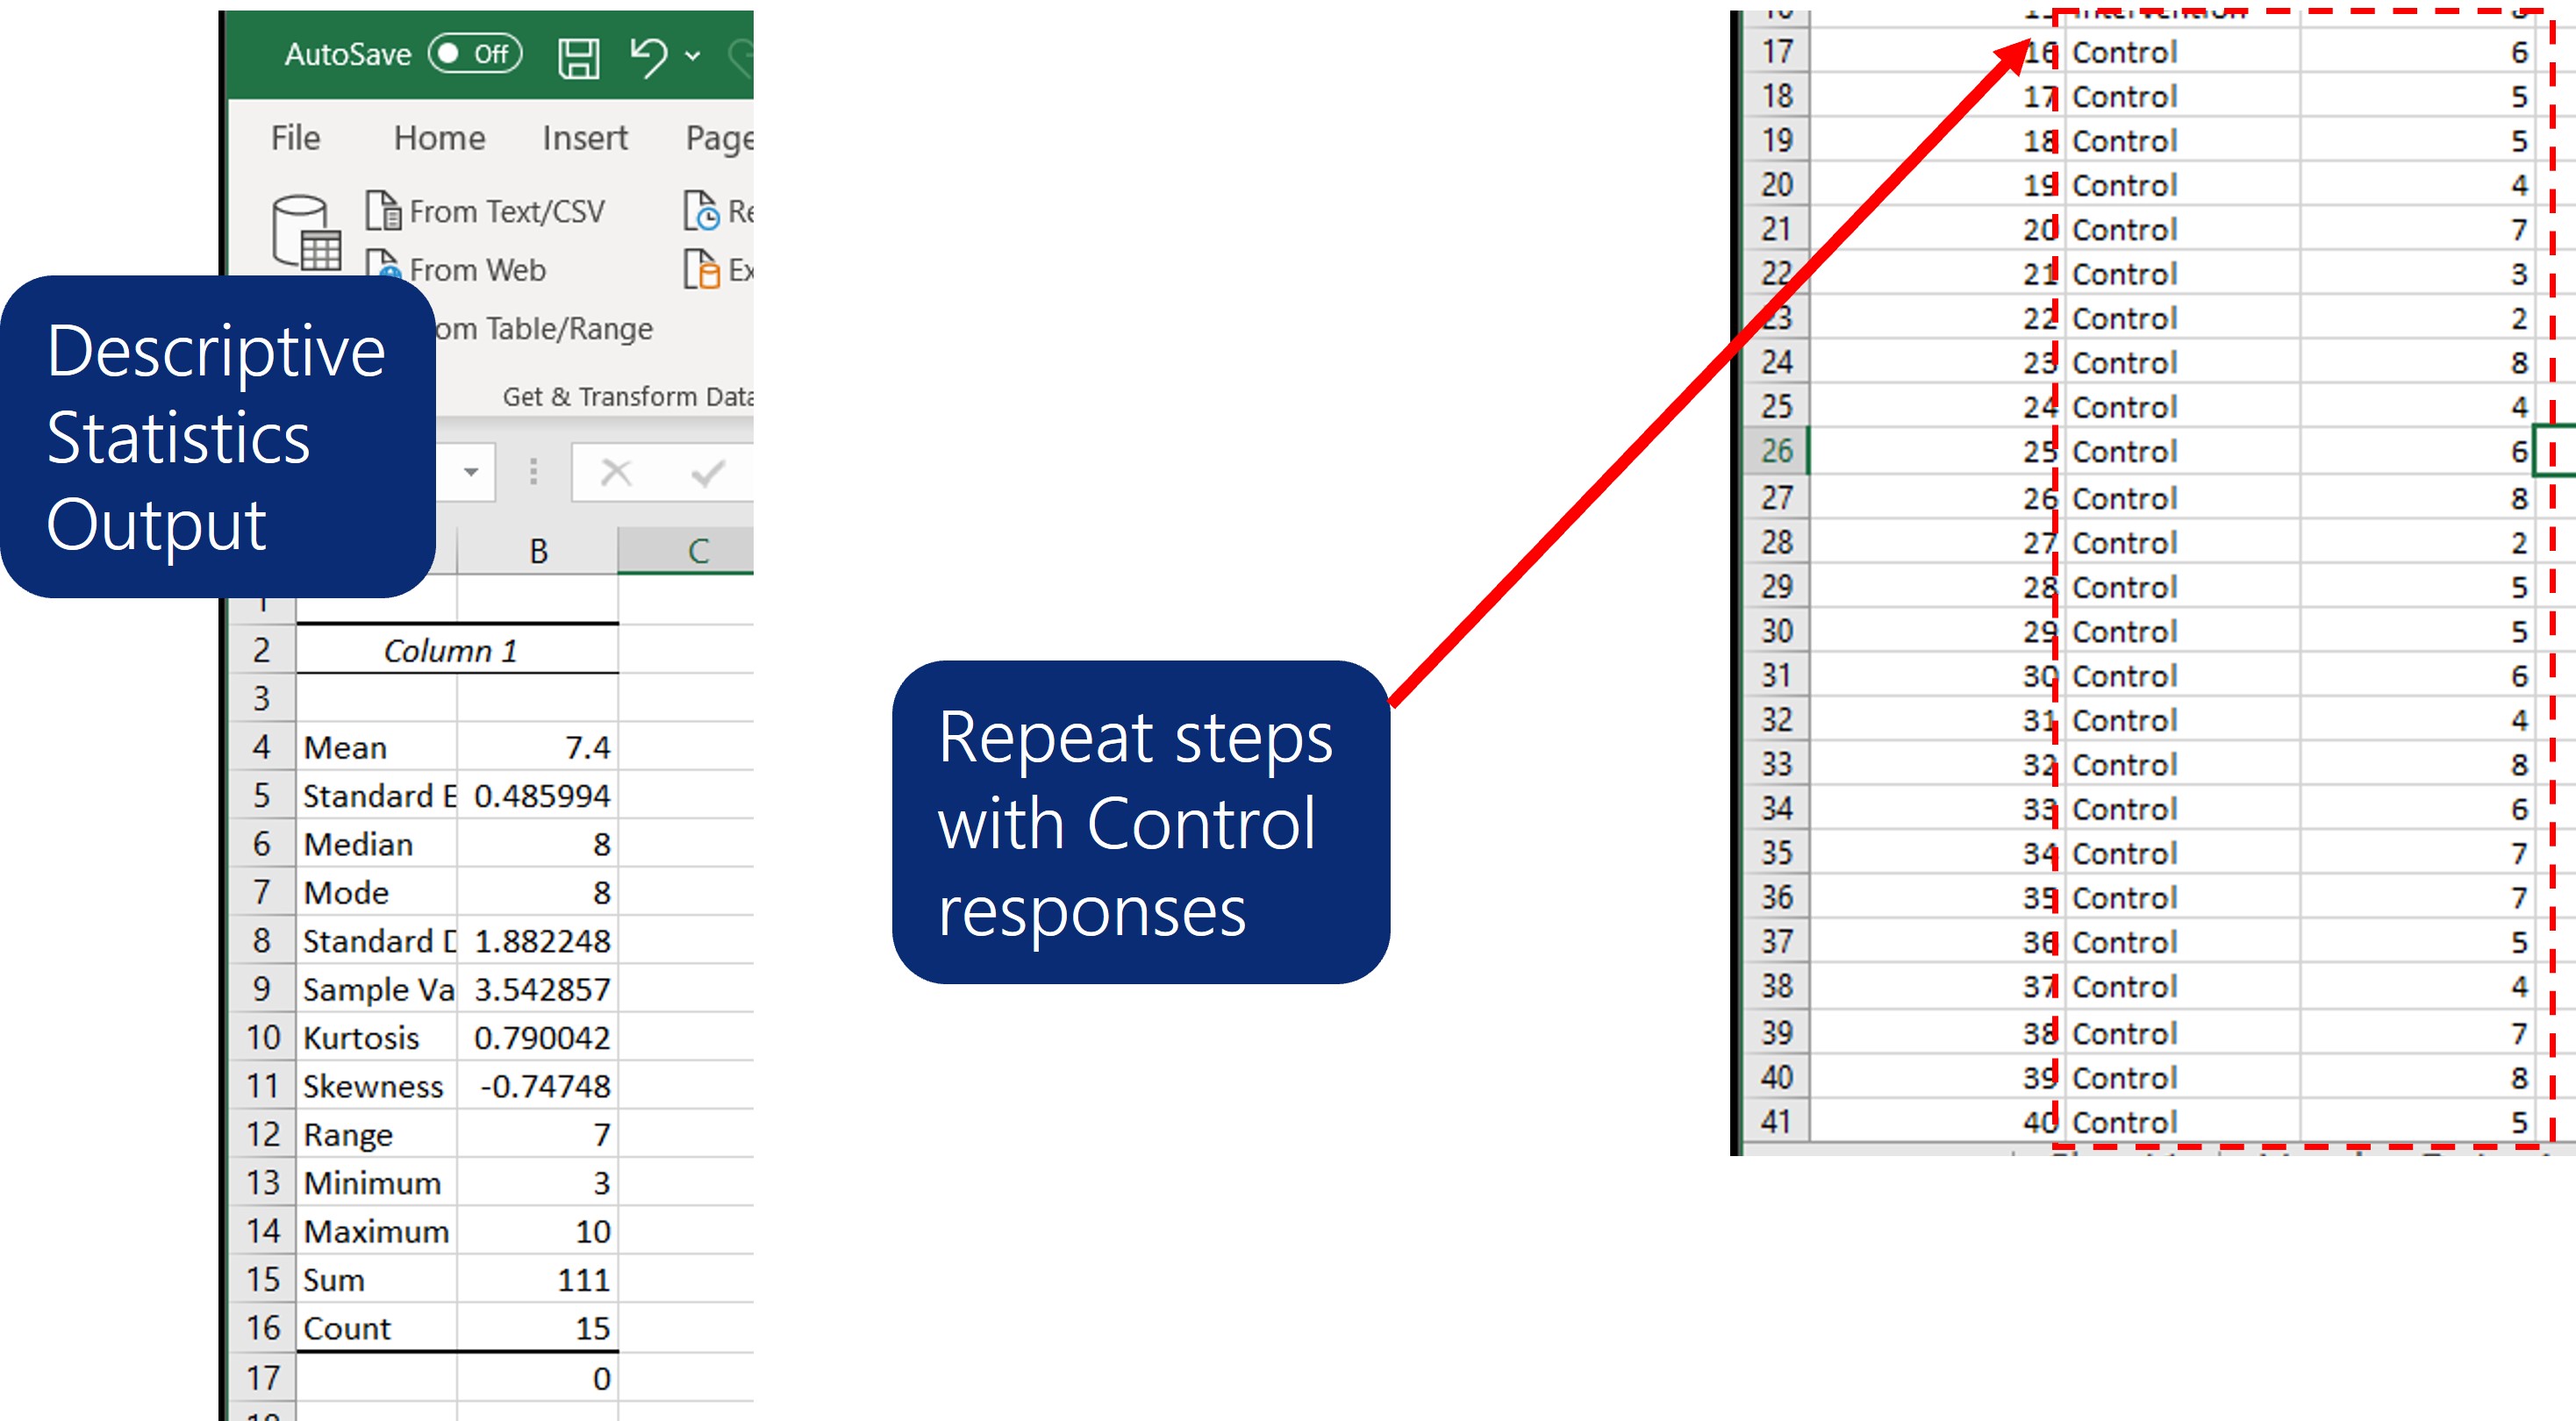
9) The columns will be presented side by side for comparison.
10) Of course, you can do Descriptive Analysis to compare other groups as well, including the ones noted above.