
Annual Gun Violence Data
Gun Violence in the UNITED STATES 2022: Examining the Burden among Children AND Teens
READ THE NEW REPORTState Firearm Violence Data
Gun Violence in the U.S. 2022: Examining the Burden Among Children and Teens
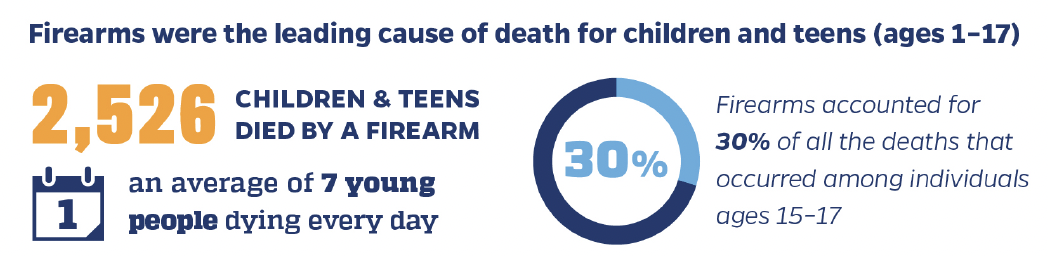
Guns were the leading cause of death among children & teens (ages 1-17), accounting for more deaths than car crashes, overdoses, or cancers.1 While the burden of gun violence remains high, there are evidence-based, equitable solutions to prevent gun violence.

Read our new Annual Firearm Mortality Report, Gun Violence in the United States 2022: Examining the Burden Among Children and Teens. This page is an iteration of the report.
2022 FIVE FAST FACTS
FOR GUN FATALITIES IN THE U.S.
27,032
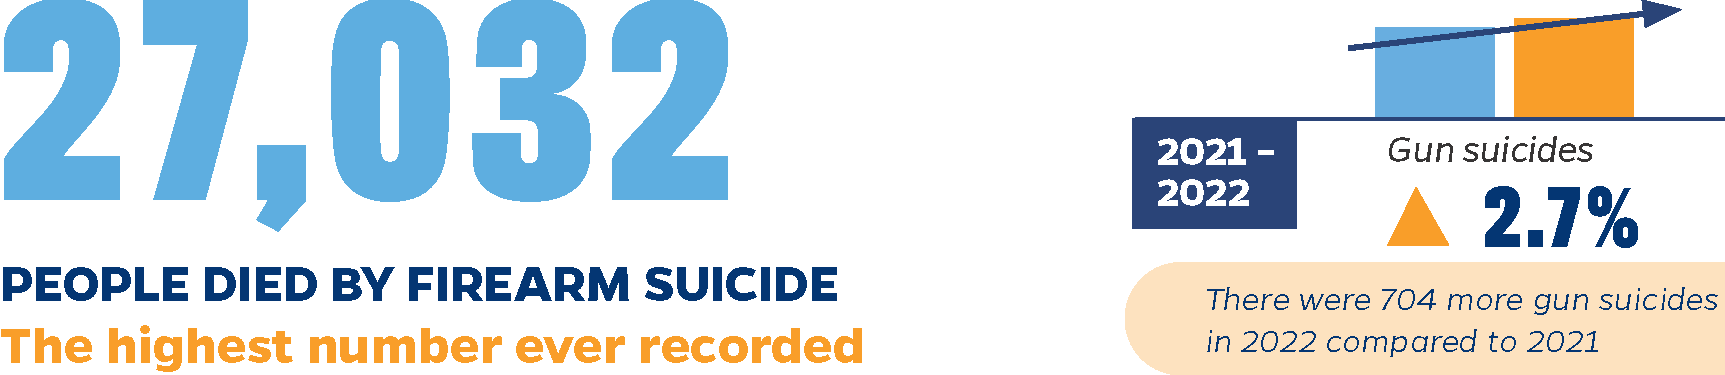
27,032 people died by firearm suicide—the highest number ever recorded.
2,526
2,526 children & teens died by a firearm—an average of 7 young people dying every day.
18x
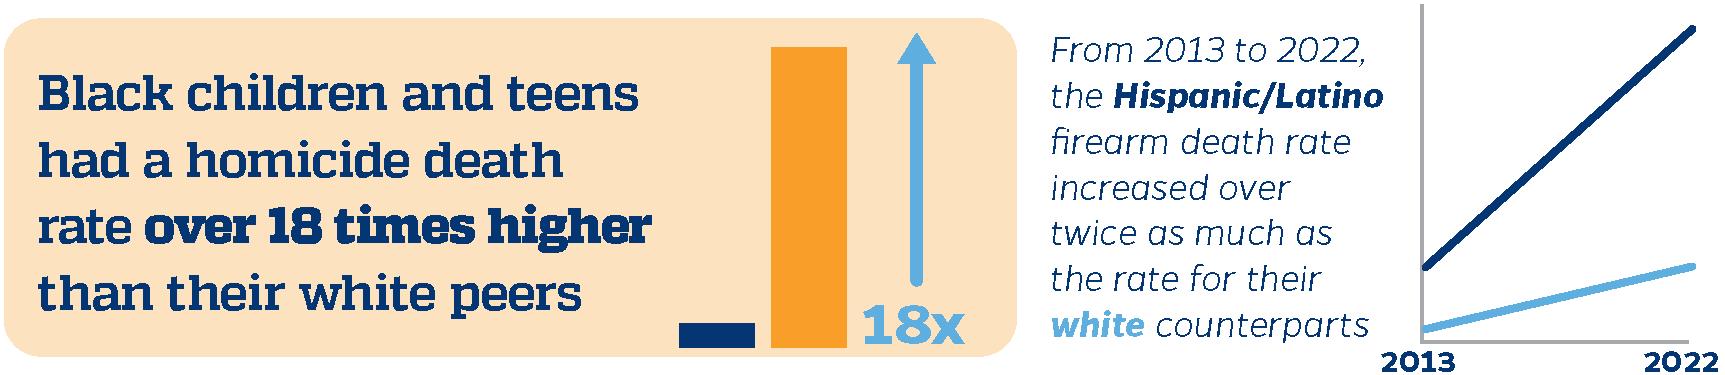
Black children & teens had a homicide rate over 18x higher than their white peers.
2x
The rate of Hispanic/Latino youth firearm death rates have doubled.
An Overview of U.S. Gun Deaths in 2022
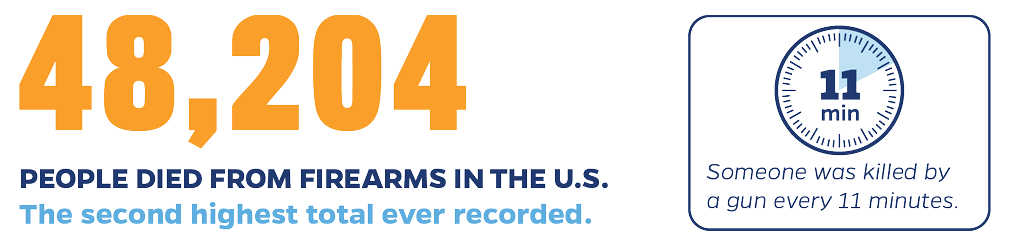
In 2022, 48,204 people died due to gun violence in the U.S., the second highest total ever recorded. Each day, an average of 132 people died from gun violence—one death every 11 minutes. The overall gun death rate declined 2.7% between 2021 and 2022, resulting in 626 fewer deaths.
- The gun homicide rate decreased 7.5% in 2022, with 1,307 fewer gun homicides compared to 2021. Despite this decrease, 19,651 people were killed by a gun in 2022, the second-highest number of gun homicide deaths ever recorded.
- Gun suicides continued to reach all-time highs, increasing by 2.7% from the previous record in 2021, resulting in a total of 27,032 people dying by gun suicide in 2022.
* The CDC data classification “legal intervention” undercounts police-involved gun fatalities classifying them as other types of gun deaths. To address this gap, media sources like the Washington Post’s Fatal Force database have tracked police-involved shootings in recent years, reporting that 1,095 people were shot and killed by police in 2022.
Lethality and Availability of Firearms
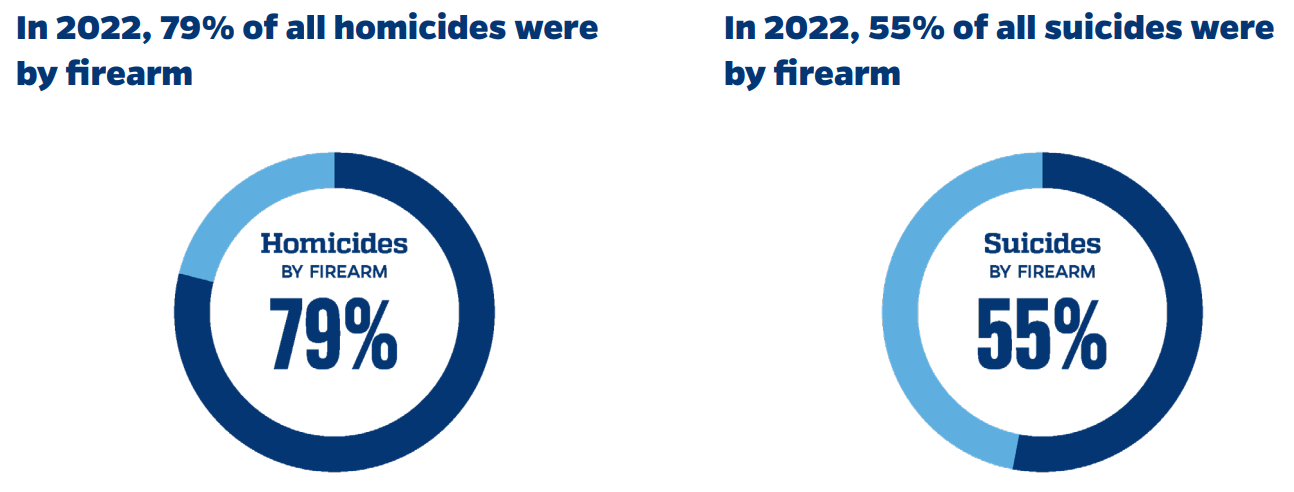
Due to their high lethality and availability, firearms fuel our country’s high suicide and homicide rates. Four out of every five homicides and more than half of all suicides are by firearm.
The Burden of Gun Violence on Children & Teens
THE Leading Cause of Death Among Young People
Firearms remained a leading cause of mortality for young people in the United States. When young people are shot and killed, they lose decades of potential: the potential to grow up, have a family, contribute to society, and pursue their passions in life. These losses are felt across families, neighborhoods, and communities.
Compared to other causes of death, gun violence often poses a larger burden on society in terms of years of potential life lost. Years of potential life lost calculations estimate the average time a person would have otherwise been expected to live if they had not died prematurely. In 2022, firearm injury deaths accounted for 1,120,312 years of potential life lost before the age of 65—more than diabetes, stroke, and liver disease combined.4
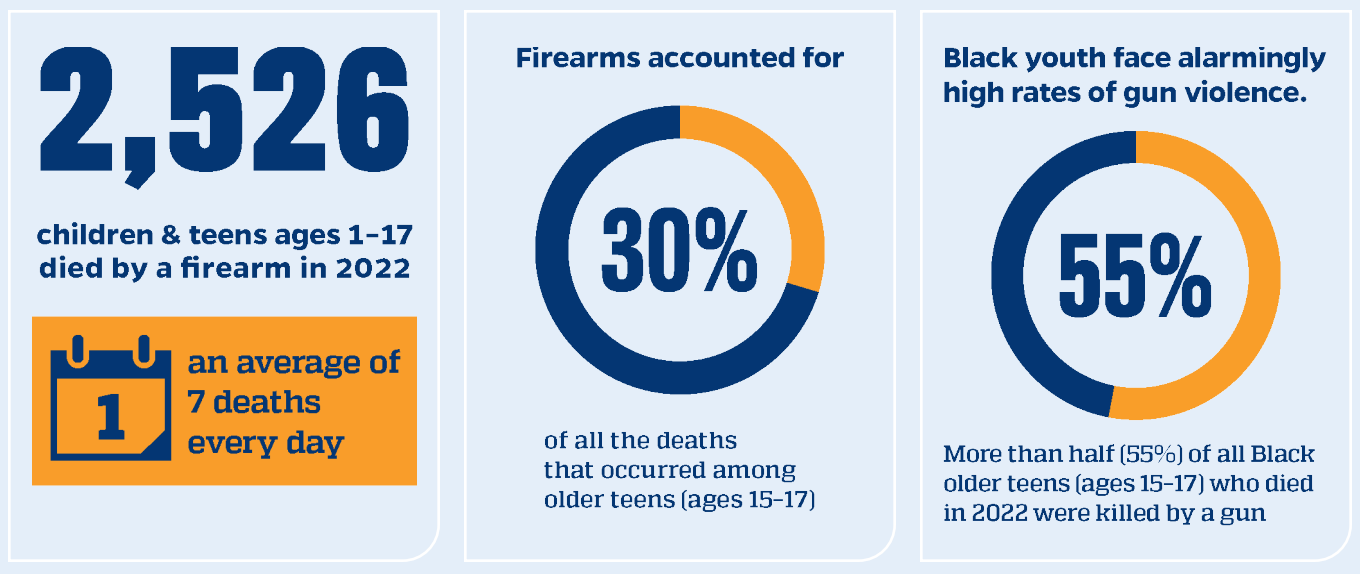
- 2,526 children and teens ages 1-17 died by a firearm in 2022 – an average of 7 deaths every day.
- Firearms accounted for 30% of all the deaths that occurred among older teens (ages 15-17).
- Black youth face alarmingly high rates of gun violence. More than half (55%) of all Black older teens (ages 15-17) who died in 2022 were killed by a gun.
* We chose not to include infant deaths in our analysis, as infants (under age 1) are at a unique risk for age-specific causes of death, including perinatal period deaths and congenital anomalies. In 2022, 16 infants were killed by firearms. Additionally, there were 1,606 deaths classified as “all other diseases” making it the third leading cause of death behind motor vehicle traffic crashes but we chose to exclude it in the graph.
Trends Over Time
Youth Gun Death Rates
The overall gun death rates among youth doubled between 2013 and 2022. This rise is predominantly attributed to an increase in gun homicides across age subgroups, though suicide is also increasing among teens (ages 10-17) and emerging adults (ages 18-19).
- Gun death rates doubled from 2013 to 2022 for children and teens (ages 1-17).
- Gun homicides nearly doubled from 2013 to 2022 for both emerging adults (ages 18-19) and children (ages 1-9), increasing from 770 to 1,453 and from 87 to 172, respectively.
- In 2022, nearly three times as many teens (ages 10-17) died by gun homicide compared to 2013, increasing from 541 in 2013 to 1,486 in 2022.
- For both teens (ages 10-17) and emerging adults (18-19), the number of gun suicide deaths increased by 40% between 2013 and 2022.
Racial Disparities in Gun Deaths Over Time
Black and Hispanic/Latino children & teens (ages 1-17) are disproportionately burdened by gun violence
- In 2022, Black youth in this age demographic had a gun death rate approximately six times higher than their white counterparts.
- Although Hispanic/Latino youth ages 1-17 had similar gun death rates to their white counterpart in 2022, the Hispanic/Latino gun death rate increased nearly twice as much as the rate for their white counterparts from 2013 to 2022.
- These disparities are particularly stark for gun homicides for children and teens ages 1-17 in 2022:
- The gun homicide rate for Black teens in this age group was 18 times higher than the rate for their white counterparts.
- The gun homicide rate for Hispanic/Latino children and teens was over three times higher than that of their white counterparts.
The suicide rates among Black and Hispanic/Latino older teens and emerging adults ages 15-19 have been rising over the last decade
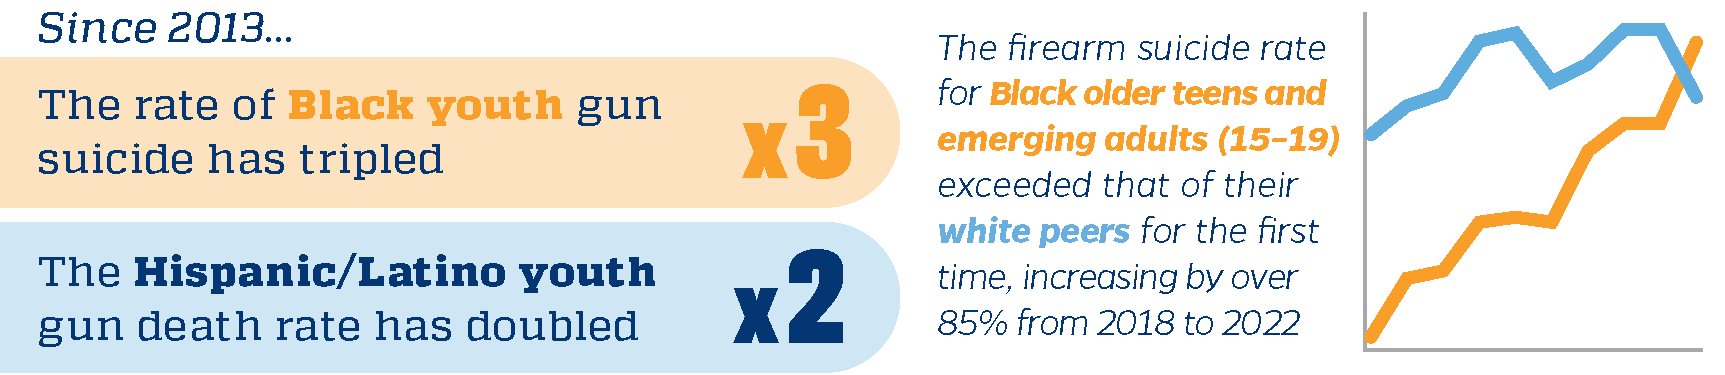
Although the absolute number of gun suicide deaths was higher for white than Black older teens and emerging adults ages 15-19 (638 deaths compared to 194 deaths), the rate of gun suicides among Black older teens and emerging adults increased almost 4 times from 2013 to 2022.
The rate of gun suicides for Hispanic/Latino older teens and emerging adults ages 15-19 doubled from 2013 to 2022.
In 2022, the gun suicide rate among Black older teens and emerging adults (ages 15-19) surpassed the rate of their white counterparts for the first time on record. The gun suicide rate for Black youth in this demographic increased 79% from 2018 to 2022. In contrast, the gun suicide rate for their white counterparts decreased from 2018 to 2022 by 15%.
Gun Violence Among Emerging Adults (Ages 18-19)
Emerging adults (ages 18-19) are uniquely impacted by gun homicides & suicides. In many states, the legal age for purchasing a firearm is 18 years old. This accessibility may increase the risk of gun-related incidents
- 2,077 emerging adults died from gun-related deaths in 2022: 557 suicides and 1,435 homicides, accounting for approximately 27% and 69% of all gun-related deaths, respectively.
- The overall gun death rate among Black emerging adults was over eight times higher compared to their white counterparts in 2022. This was driven mainly by homicides: the homicide rate for Black emerging adults was 24 times that of their white counterparts.
- In 2022, the homicide rate for Black females in this age demographic was approximately 13 times higher than for their white counterparts, while the homicide rate for Black males (ages 18-19) was approximately 27 times higher than for their white counterparts.
- Between 2013 and 2022, the suicide rate for Black emerging adults increased by over 5 times (413%).
- Between 2018 and 2022 alone, the suicide rate for Black emerging adults increased by 85%. The homicide rate increased by 56%.
Gun Deaths Rates (Per 100,000) for Black and White Emerging Adults (Ages 18-19) from 2013-2022
* “Other” gun deaths include legal intervention, unintentional, and unclassified.
Youth Gun Violence by State
Gun death rates vary widely across the U.S. due to differences in socio-economic factors, demographics, and, importantly, gun policies
- Among U.S. youth gun deaths ages 1-19, Mississippi had the highest gun death rates while Massachusetts had the lowest gun death rates in 2022. In both states, homicides constituted the majority of gun deaths.
- While most youth gun deaths ages 1-19 across states were largely driven by homicides, youth gun deaths in Idaho were largely driven by suicides than any other state and accounted for approximately 83% of Idaho’s gun death rate.
- Alaska and Montana had the highest rates of youth gun deaths ages 1-19 due to “other” causes (legal intervention, unintentional and undetermined intent). Delaware and West Virginia youth gun death rates were comprised entirely of "other" gun deaths.
* “Other” gun deaths include legal intervention, unintentional, and unclassified. Other states (Hawaii, Maine, New Hampshire, North Dakota, Rhode Island, Vermont, and Wyoming) were excluded because they had suppressed values for all gun death rates.
Youth Gun Violence by Urbanization
Rural counties had the highest rate of gun suicides compared to metropolitan counties
- Overall, rural counties had the highest rate of gun deaths. There were similar rates of gun deaths among large, medium, and small metropolitan counties.
- Large metropolitan counties had the highest gun homicide rate compared to rural counties.
- Rural counties had the highest rate of gun suicides compared to metropolitan counties.
*The 2013 urban classifications were combined for simplification. Large Central Metro and Large Fringe Metro classifications were combined as “Large Metro.” Medium Metro and Small Metro classifications were combined as “Medium & Small Metro.” Lastly, Micropolitan and Noncore classifications were combined as “Rural.” Crude rates were used for this analysis because CDC Wonder does not report age-adjusted rates by urban classification.
Policy Recommendations
Gun deaths remain the leading cause of death for young people and disproportionately impacts vulnerable communities. While all the policy recommendations may not directly address youth, we believe that enacting these policies will address upstream factors to decrease the burden of gun violence on youth across the country.
Adopt Child Access Prevention (CAP) Laws to Promote Safe and Secure Storage Practices
More than half of all U.S. gun owners do not practice safe firearm storage.5 In fact, 4.6 million minors in the U.S. live in homes with at least one gun that is loaded and unlocked, exposing children to firearms and increasing the risk of gun violence among children and youth.6
Many of these deaths can be prevented through strong Child Access Prevention (CAP) laws which require that guns stored in households with a child or teen be kept secured when unattended. Strong CAP laws are an effective tool to promote responsible firearm storage practices by holding negligent gun owners accountable when a child gains unauthorized access to a firearm. These laws are linked to sizable reductions in child and teen gun deaths, including reductions in youth suicide, accidental shootings, and homicides.7,8
Prevent Prohibited People from Purchasing a Gun Through Firearm Purchasing Laws
Most states do not require background checks on private purchases, meaning that people convicted of a felony or who are otherwise prohibited from possessing a gun can purchase one from a private seller. To address this dangerous gap, states should implement firearm purchaser licensing laws (sometimes referred to as permit to purchase) that require all prospective gun purchasers to obtain a license prior to buying a gun from a dealer or a private seller.
Permit-to-purchase laws enhance universal background checks by establishing a licensing application process. The additional components of permit-to-purchase laws—fingerprinting, a more thorough vetting process, and a built-in waiting period—all play a vital role in preventing people with a history of violence, those at risk for future interpersonal violence or suicide, and gun traffickers from obtaining firearms. Research shows that these laws are among the most effective policies in reducing many forms of gun violence including gun homicides, suicides, mass shootings, and shootings by police.9,10,11
Remove Firearms from Individuals Determined to be at Elevated Risk for Violence
In some cases, people who are not otherwise prohibited from owning a gun may be at clear risk of violence to themselves or others, often during a time of crisis or in a domestic violence situation. Strong Domestic Violence Protection Orders (DVPOs) and Extreme Risk Protection Orders (ERPOs) include mechanisms to temporarily remove firearms from individuals at risk for suicide or violence against others. States should enact and implement ERPOs and enhance existing DVPOs to include firearm relinquishment requirements for respondents.
Invest in Community Violence Intervention
Community violence intervention (CVI) programs aim to identify and support the small number of people at risk for violence by helping them peacefully resolve conflicts and providing them with wraparound mental health and social support. These programs can also address the dangerous environments which facilitate violence including blighted properties. CVI is most effective when cities also establish inter-agency processes, like a Homicide Review Commission, to identify the drivers of violence within a city and deploy resources comprehensively to address these drivers of violence.12
When properly funded, implemented and sustained, CVI programs can effectively reduce gun violence within the communities most impacted by gun homicide.13, 14,15
Regulate the Carrying of Guns in Public
Carrying firearms in public places poses a serious threat to safety. Over the last four decades, states have weakened their public carry laws making it easier for people to carry a loaded firearm in public places. Today, most states no longer need a permit to carry a concealed gun in public. As a result, an estimated six million adults carry loaded handguns in public each day.16
Permissive public carry and stand-your-ground laws increase violence by allowing people with violent histories to carry their firearms in public, providing more opportunities for armed intimidation and shootings in response to hostile interactions, and increasing criminals’ access to guns from thefts from motor vehicles. Research shows that when states weakened or removed concealed carry permitting requirements they experienced a 29% increase in violent crimes.17 Similarly, the passage of state ”stand your ground” laws were linked to a 8% increase in homicide rates.18 To reduce gun violence, states should strengthen their concealed and open carry laws and repeal stand-your-ground laws.
The ongoing crisis of gun violence is preventable. We must address this crisis through a public health approach pushing for equitable, evidence-based gun violence solutions.
The Center Resources
Glossary of Terms
Age adjusted rate: The rates of almost all causes of death vary by age. Age adjustment is a technique for "removing" the effects of age from crude rates, to allow meaningful comparisons across populations with different underlying age structures. Age-adjusted death rates are weighted averages of the age-specific death rates, where the weights represent a fixed population by age. An age-adjusted rate represents the rate that would have existed had the age-specific rates of the particular year prevailed in a population whose age distribution was the same as that of the fixed population. Age-adjusted rates should be viewed as relative indexes rather than as direct or actual measures of mortality risk.
Burden of injury: Describes the impact of a health problem (injury), including death and loss of health due to injuries, related financial costs, and other indicators.
Cause of death: Based on medical information—including injury diagnoses and external causes of injury—entered on death certificates filed in the U.S. This information is classified and coded per the International Statistical Classification of Diseases and Related Health Problems, 10th Revision (ICD–10).
International Classification of Diseases (ICD): Causes of death are classified per the International Classification of Disease. Deaths for 1999 and beyond are classified using the Tenth Revision (ICD-10). ICD is designed to promote international comparability in the collection, processing, classification, and presentation of mortality statistics. This includes providing a format for reporting causes of death on the death certificate. The reported conditions are then translated into medical codes through the use of the classification structure and the selection and modification rules contained in the applicable revision of the ICD, published by the World Health Organization (WHO).
Underlying Cause of Death database: The database contains mortality data based on information from all death certificates filed in the fifty states and the District of Columbia. Deaths of nonresidents (e.g. nonresident aliens, nationals living abroad, residents of Puerto Rico, Guam, the Virgin Islands, and other territories of the U.S.) and fetal deaths are excluded. Each death certificate identifies a single underlying cause of death and demographic data.
County Classification: The CDC categorizes all counties into six levels of urbanization that incorporate population number and density. From largest and most urban to smallest and most rural, they are:
Large central metro counties: Counties part of a metropolitan statistical area with ≥1 million population and covers a principal city; most urban, large cities.
Large fringe metro counties: Counties part of a metropolitan statistical area with ≥1 million population but does not cover a principal city; akin to suburbs.
Medium metro counties: Counties part of a metropolitan statistical area of 250,000–999,999 population.
Small metro counties: Counties part of a metropolitan statistical area of less than 250,000 population.
Micropolitan (non-metro) counties: Counties part of a micropolitan statistical area (has an urban cluster of ≥10,000 but <50,000 population).
Non-core (non-metro) counties: Counties not part of a metropolitan or micropolitan statistical area; the most rural counties.
Injury Intent: Describes whether an injury was caused by an act carried out on purpose by oneself or by another person(s), with the goal of injuring or killing. For the CDC data used in this report, all injury-related causes of death are classified by intent and by mechanism, determined according to the ICD-10 external cause of injury coded as the underlying cause of death on the death certificate.
Homicide: Injuries inflicted by another person with the intent to injure or kill, by any means. Excludes injuries due to legal intervention and operations of war. The ICD-10 cause of death codes for firearm homicide include X93 Assault by handgun discharge; X94 Assault by rifle, shotgun, and larger firearm discharge; X95 Assault by other and unspecified firearm and gun discharge; and *U01.4 Terrorism involving firearms.
Legal Intervention: Injuries inflicted by the police or other law-enforcing agents, including military on duty, in the course of arresting or attempting to arrest lawbreakers, suppressing disturbances, maintaining order, and other legal actions. Excludes injuries caused by civil insurrections. The ICD-10 cause of death code for legal intervention by firearm is Y35.0 Legal intervention involving firearm discharge.
Suicide: An intentionally self-inflicted injury that results in death. The ICD-10 cause of death codes for firearm suicide are X72 Intentional self-harm by handgun discharge; X73 Intentional self-harm by rifle, shotgun, and larger firearm discharge; and X74 Intentional self-harm by other and unspecified firearm and gun discharge.
Undetermined Intent: Events where available information is insufficient to enable a medical or legal authority to make a distinction between accident, self-harm, and assault. The ICD-10 cause of death codes for firearm deaths of undetermined intent are Y22 Handgun discharge, undetermined intent; Y23 Rifle, shotgun and larger firearm discharge, undetermined intent; and Y24 Other and unspecified firearm discharge, undetermined intent.
Unintentional: Unintentional injury that results in death. The ICD-10 cause of death codes for unintentional firearm deaths are W32 Accidental handgun discharge and malfunction; W33 Accidental rifle, shotgun, and larger firearm discharge; and W34 Accidental discharge and malfunction from other and unspecified firearms and guns.
Injury Mechanism or Method: The cause, or mechanism, of injury is the way in which the person sustained the injury; how the person was injured; or the process by which the injury occurred.
Suppressed: Rates are marked as suppressed when there are zero to nine deaths.
Unreliable: Rates are marked as "unreliable" when the death count is less than 20.
References
1. Provisional death counts for Coronavirus disease 2019 (COVID-19). (2022). National Center for Health Statistics. Available: https://www.cdc.gov/nchs/nvss/vsrr/covid_weekly/index.htm#SexAndAge
4. WISQARS years of potential life lost (YPLL) Report, 1981 - 2020. (2020). Centers for Disease Control and Prevention. Available: https://wisqars.cdc.gov/ypll
5. Webster DW, Vernick JS, Zeoli AM, & Manganello JA. (2004). Association between youth-focused firearm laws and youth suicides. JAMA Network. https://jamanetwork.com/journals/jama/fullarticle/199194
6. Miller M & Azrael D. (2022). Firearm storage in US households with children. JAMA Network. https://jamanetwork.com/journals/jamanetworkopen/fullarticle/2789269
7. Azad HA, Monuteaux MC, Rees CA, Siegel M, Mannix R, Lee LK, Sheehan KM, & Fleegler EW. (2020). Child Access Prevention firearm laws and firearm fatalities among children aged 0 to 14 Years, 1991-2016. JAMA Pediatrics. https://jamanetwork.com/journals/jamapediatrics/fullarticle/2761305
8. Webster DW, Vernick JS, Zeoli AM, & Manganello JA. (2004). Association between youth-focused firearm laws and youth suicides. Jama Network. https://jamanetwork.com/journals/jama/fullarticle/199194
9. McCourt AD, Crifasi CK, Stuart EA, Vernick, JS, Kagawa RMC, Wintemute GJ, & Webster DW. (2020). Purchaser licensing laws, point-of-sale background check laws, and firearm homicide and suicide in 4 US States, 1985-2017. American Journal of Public Health. https://doi.org/10.2105/AJPH.2020.305822
10. Webster DW, McCourt AD, Crifasi CK, Booty MD, & Stuart EA. (2020). Evidence concerning the regulation of firearms design, sale, and carrying on fatal mass shootings in the United States. Criminology and Public Policy. https://doi.org/10.1111/1745-9133.12487
11. Crifasi CK, Pollack K, & Webster DW. (2016). Effects of state-level policy changes on homicide and nonfatal shootings of law enforcement officers. Injury Prevention. http://dx.doi.org/10.1136/injuryprev-2015-041825
12. Azrael D, Braga AA, & O’Brien ME. (2010). Developing the capacity to understand and prevent homicide: An evaluation of the Milwaukee Homicide Review Commission. National Institute of Justice. Available: https://nij.ojp.gov/library/publications/developing-capacityunderstand-and-prevent-homicide-evaluation-milwaukee
13. Webster DW. (2022). Public health approaches to reducing community gun violence. Daedalus. https://doi.org/10.1162/daed_a_01886
14. Branas C, Buggs S, Butts JA, Harvey A, Kerrison EM, Meares T, Papachristos AV, Pfaff J, Piquero AR, Richardson J, Roman CG, & Webster D. (2020). Reducing violence without police: A review of research evidence. John Jay College Research Advisory on Preventing and Reducing Community Violence. John Jay College of Criminal Justice, City of New York. https://johnjayrec.nyc/2020/11/09/av2020/
15. Webster DW, Tilchin CG, & Doucette ML. (2023). Estimating the effects of safe streets Baltimore on gun violence. Johns Hopkins Center for Gun Violence Solutions. Available: https://publichealth.jhu.edu/sites/default/files/2023-03/estimating-the-effects-of-safe-streets-baltimore-on-gun-violence-march-2023.pdf
16. Rowhani-Rahbar A, Gallagher A, Azrael D, & Miller, M. (2022). Trend in loaded handgun carrying among adult handgun owners in the United States, 2015‒2019. American Journal of Public Health. https://pubmed.ncbi.nlm.nih.gov/36383941/
17. Donohue JJ, Cai SV, Bondy MV, & Cook PJ. (2022). More guns, more unintended consequences: the effects of right-to-carry on criminal behavior and policing in US cities (No. w30190). National Bureau of Economic Research. Available: https://www.nber.org/papers/w30190
18. Degli Esposti M, Wiebe DJ, Gasparrini A, & Humphreys DK. (2022). Analysis of “stand your ground” self-defense laws and statewide rates of homicides and firearm homicides. JAMA Network. https://jamanetwork.com/journals/jamanetworkopen/fullarticle/2789154